Tryon Creek Watershed Council
A number of students worked with the Tryon Creek Watershed Council to complete a variety of projects. Erin Butts completed an analysis to determine potential wildlife corridors in and around the Tryon Creek Watershed. This project involved finding fragmented areas to the Tryon Creek Natural Areas and using that information (and other data) in a specialized software, Corridor Designer, to determine the best habitat patches and potential wildlife corridors.
Another project, completed by Mirana Rideout, was to identify and prioritize areas within Tryon Creek Watershed for storm water treatment. This included finding areas for restoring fragmented riparian buffers and building flow control devices to protect the watershed from harsh pollutants and road sediments through filtration. The following factors were considered: Impervious surface cover, fragmentation of riparian buffers and locations of steep drainage. The project identified tax lots, prioritized by their percentage of impervious surface cover and made suggestions for bioswale construction.
The focus of Tim Prentice's project was to locate and map fish passage barriers within the Tryon Creek Watershed and acquire attributes related with possible fish passage barriers, find any street and creek intersections with culverts or other passage, and document all restoration projects within the watershed.
Terri Lynch focused on converting all of the Watershed's data and map projects into an open source software, QGIS, for use by the Council staff. This required a great deal of technical work and will allow the Council staff to continue working with the maps for further analysis, updating data, or other mapping efforts.
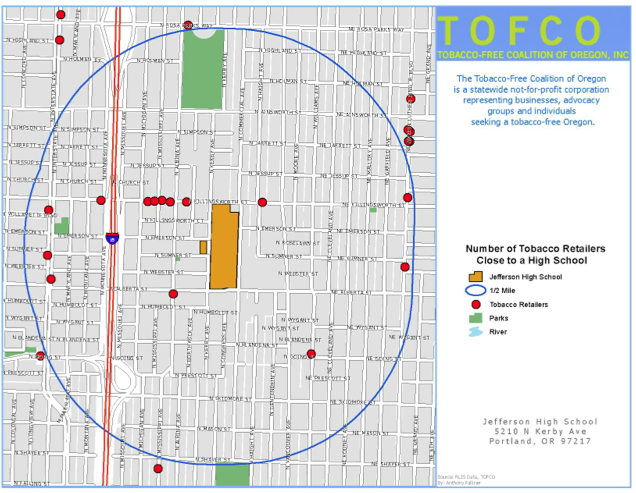
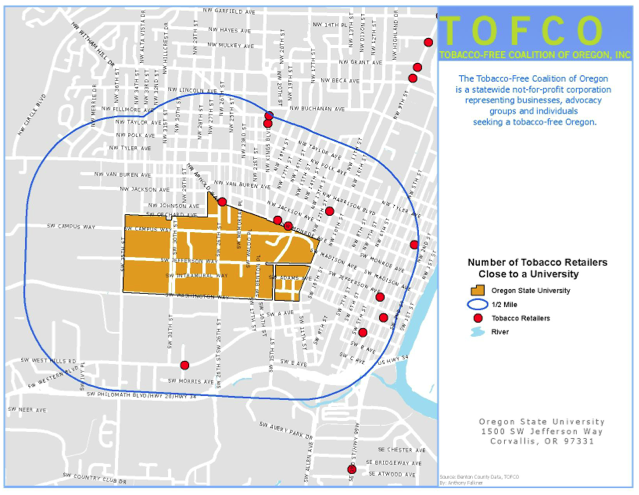
Tobacco Free Coalition of Oregon
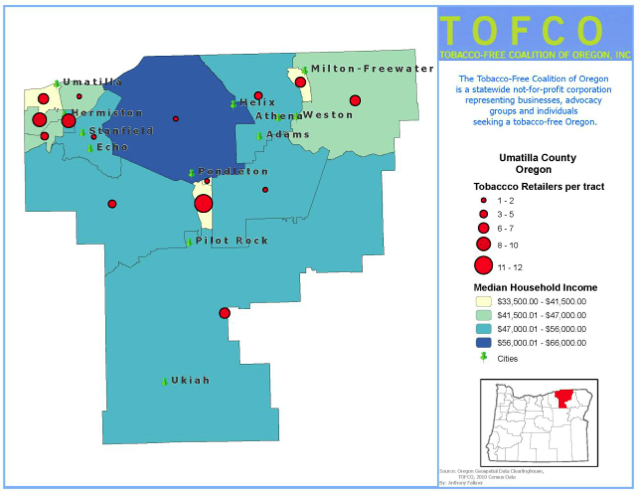
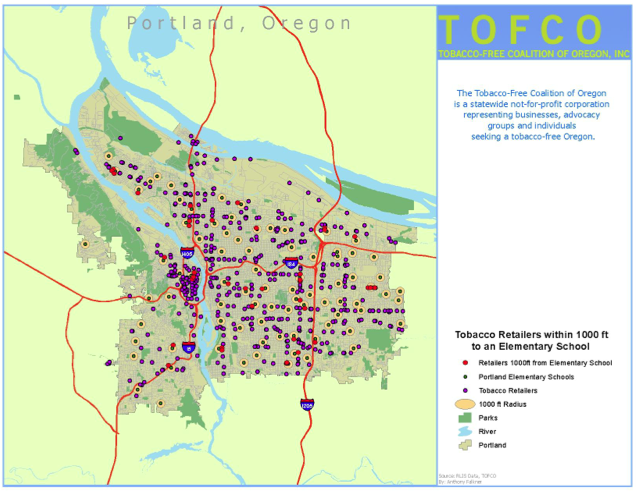
There were two main goals of this project: Determine the relationship between tobacco retailers and schools in Oregon & the city of Portland, and investigate the relationship between tobacco retailers and income. Anthony Faulkner created maps to show tobacco retailers in and around elementary & high schools in Portland, as well as the major Universities in Oregon. Targeted county maps were also created to show income and number of retailers per tract.
Oregon Health Authority
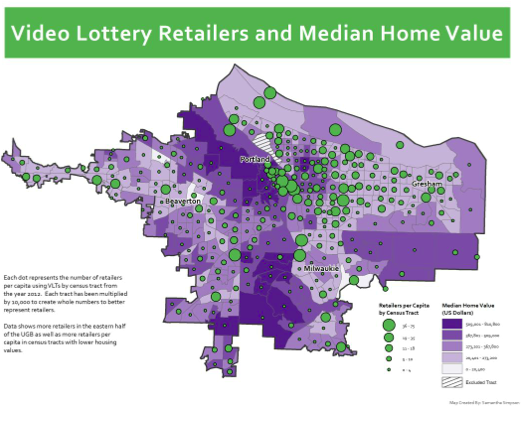
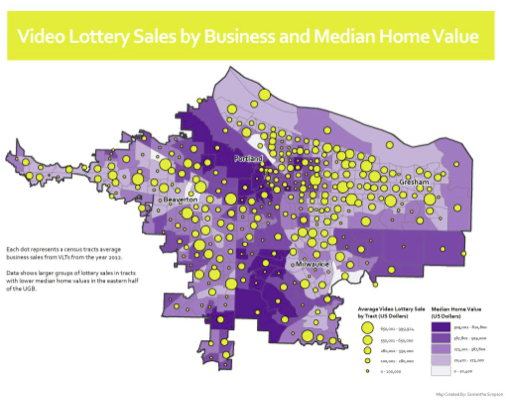
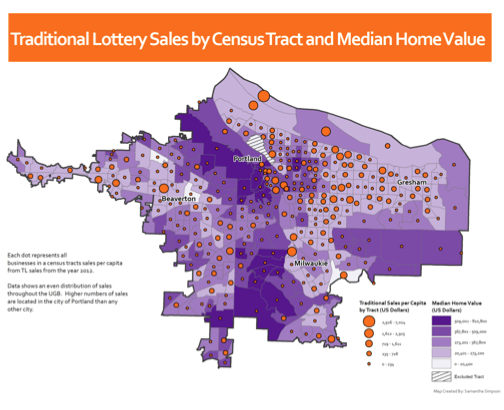
Samantha Simpson worked with the Oregon Environmental Health Tracking Program to determine if a correlation exists between the locations and sales of the state run lottery and demographics of the persons living in the highest locations/sales areas. The maps focused on the median house values within census tracts. House values are thought to give a better perspective on people living in tracts compared to income levels that can have dramatic shifts from high to low. Both traditional and video lottery sales were examined.
Johnson Creek Watershed Council
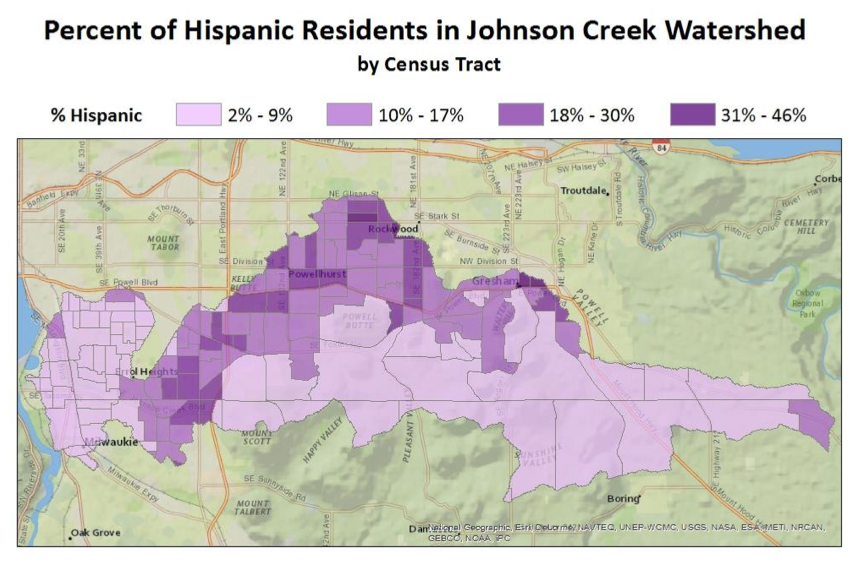
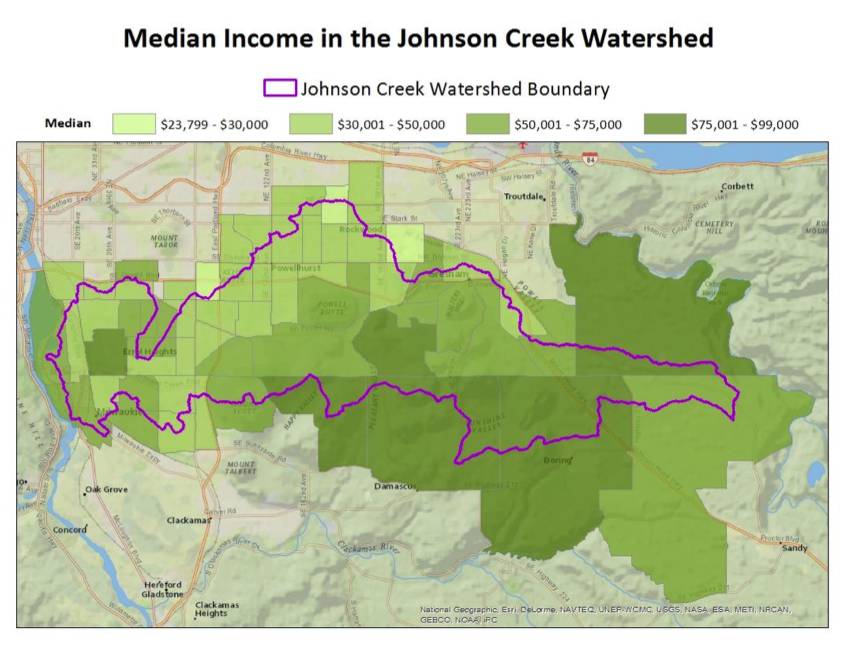
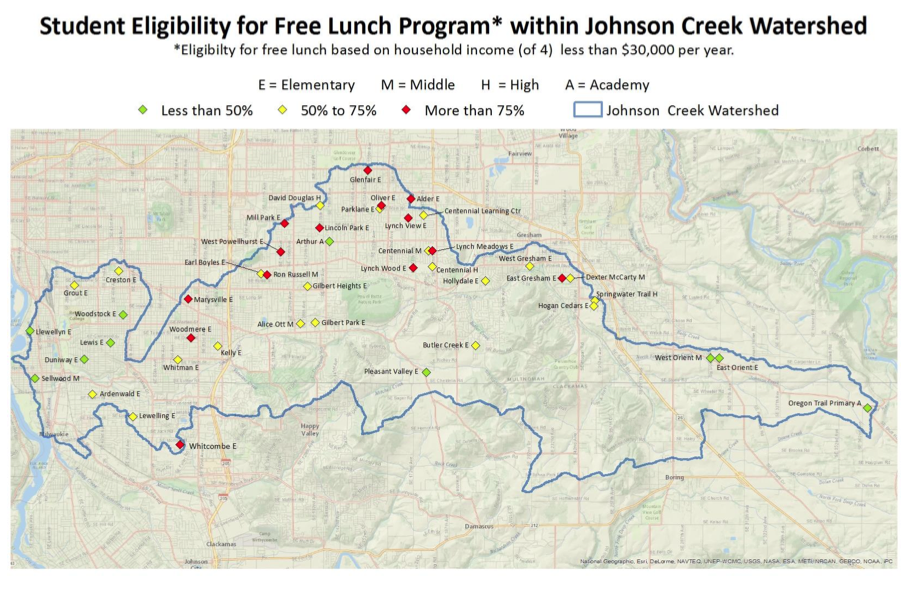
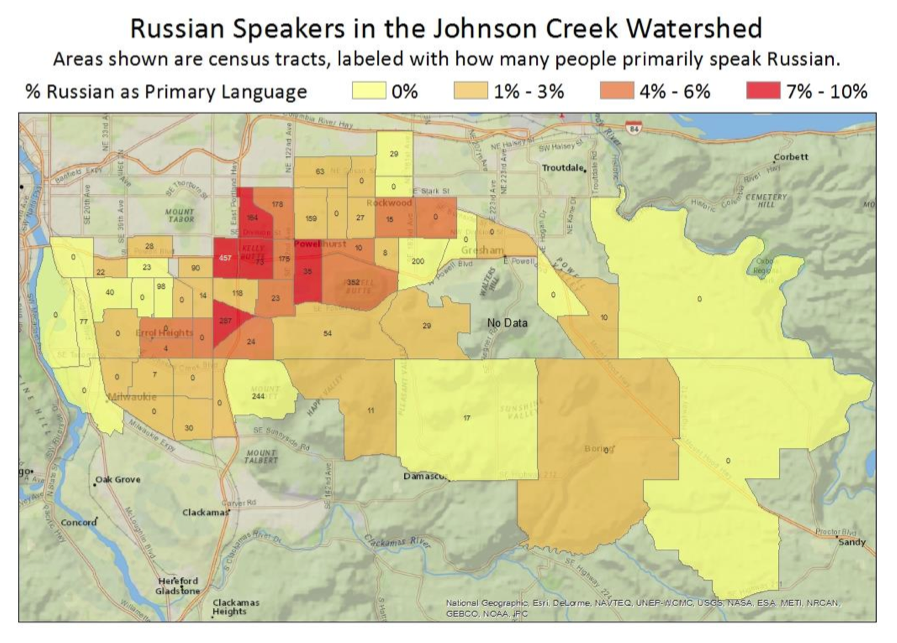
Both Cindy Moomaw and Erik Pearson worked with the Johnson Creek Watershed Council (JCWC) to help promote the restoration and stewardship of the watershed. In order to be more effective, the Council wanted to know more about the demographic makeup of the region. The scope of Cindy's project was to map three parameters in the watershed; population, income, and primary non-English language spoken in the area. Below are a selection of the maps created for the JCWC.
Erik assisted the council on two projects - GIS data management and creating an web-based map to replace their static maps for public interaction and understanding of watershed characteristics. The data management component of the project included updating datasets, creating a file structure that eliminated duplication and increased efficiency, and creating consistent data formats. The web-based map was created using TileMill for maximum cartographic freedom and ease of use. It can be found on the Johnson Creek Watershed Council's website: http://jcwc.org/maps/
Erik assisted the council on two projects - GIS data management and creating an web-based map to replace their static maps for public interaction and understanding of watershed characteristics. The data management component of the project included updating datasets, creating a file structure that eliminated duplication and increased efficiency, and creating consistent data formats. The web-based map was created using TileMill for maximum cartographic freedom and ease of use. It can be found on the Johnson Creek Watershed Council's website: http://jcwc.org/maps/

Cultural Atlas of Portland
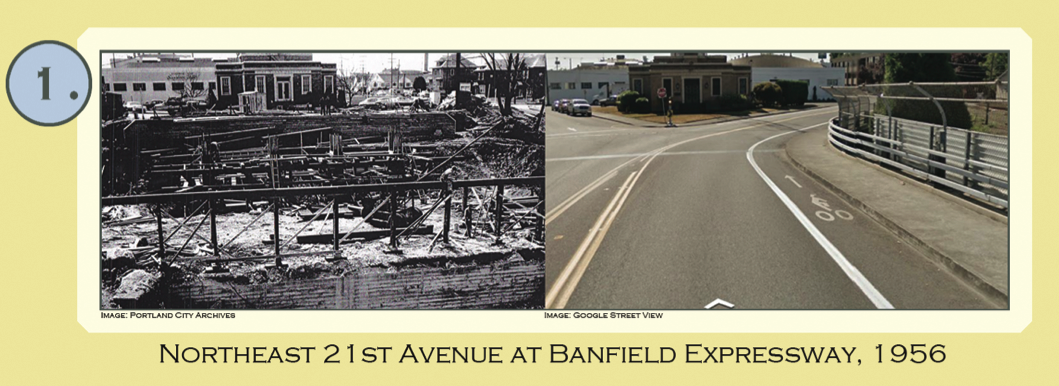
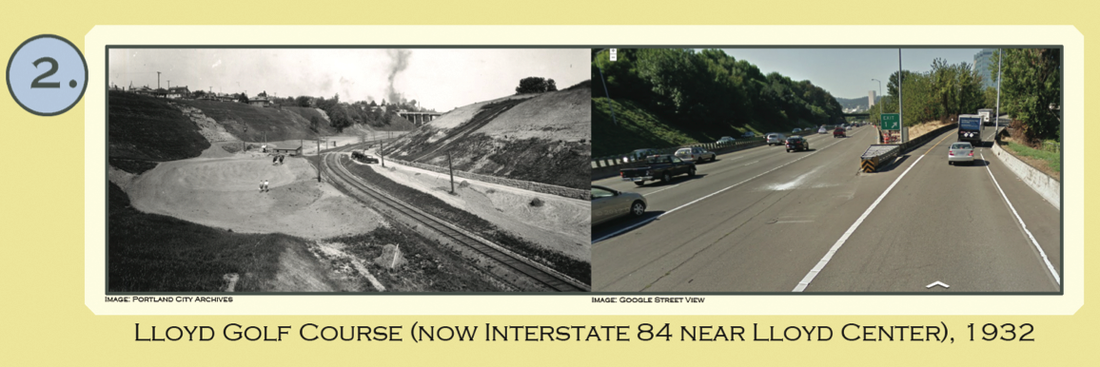
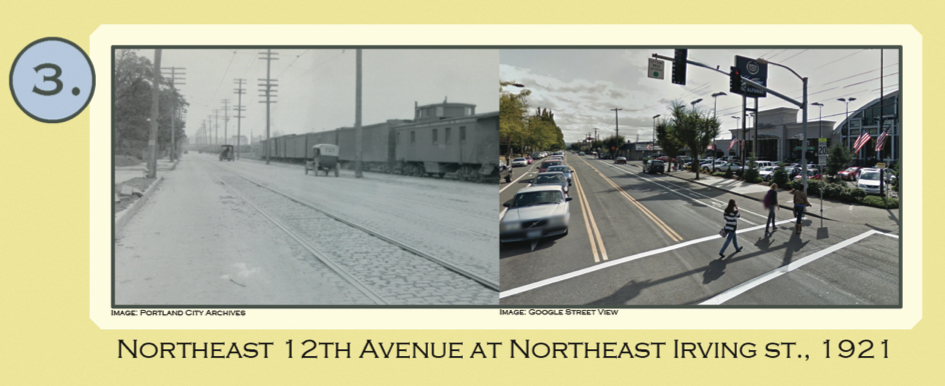
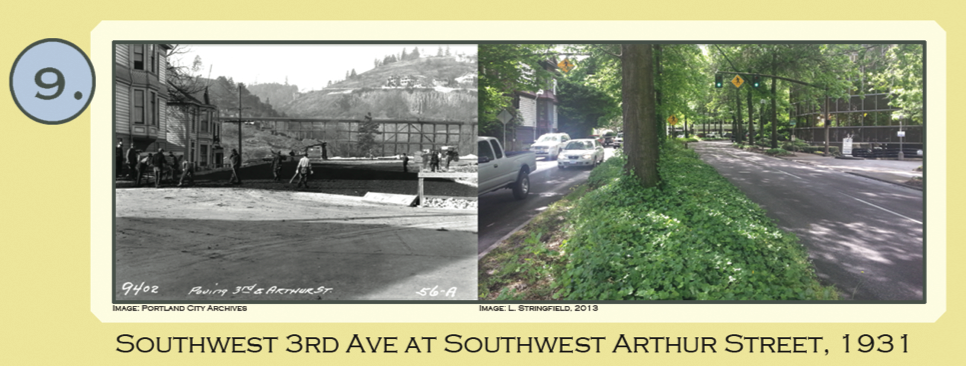
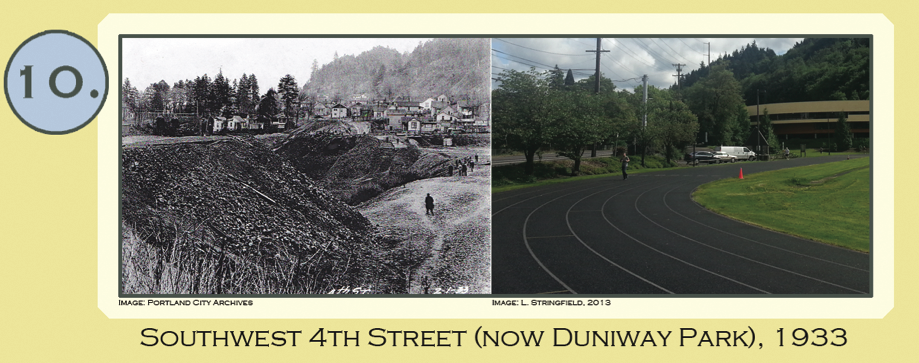
Mark Prescott worked with David Banis at Portland State University on a (in-progress) Cultural Atlas of Portland project. Mark focused on changes in Portland’s geography and landscape through the 20th century by large-scale transportation projects like bridges, highways, and rail. The two areas of research included Sullivan’s Gulch in northeast Portland and the Lair Hill area in southwest Portland.
In order to illustrate the impact of past transportation projects, Mark used a “now and then” format by locating several relevant photographs and using re-photography to document the current land-use. Juxtaposed, they summarize several decades of change to Portland’s urban landscape. Below are 5 of the 12 photographs from the project.
In order to illustrate the impact of past transportation projects, Mark used a “now and then” format by locating several relevant photographs and using re-photography to document the current land-use. Juxtaposed, they summarize several decades of change to Portland’s urban landscape. Below are 5 of the 12 photographs from the project.
PCC Sustainability
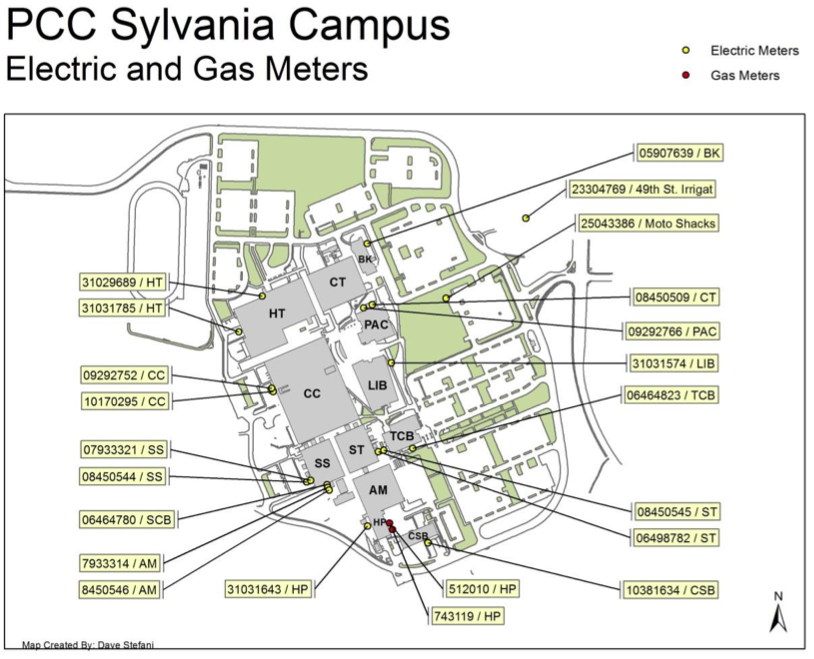
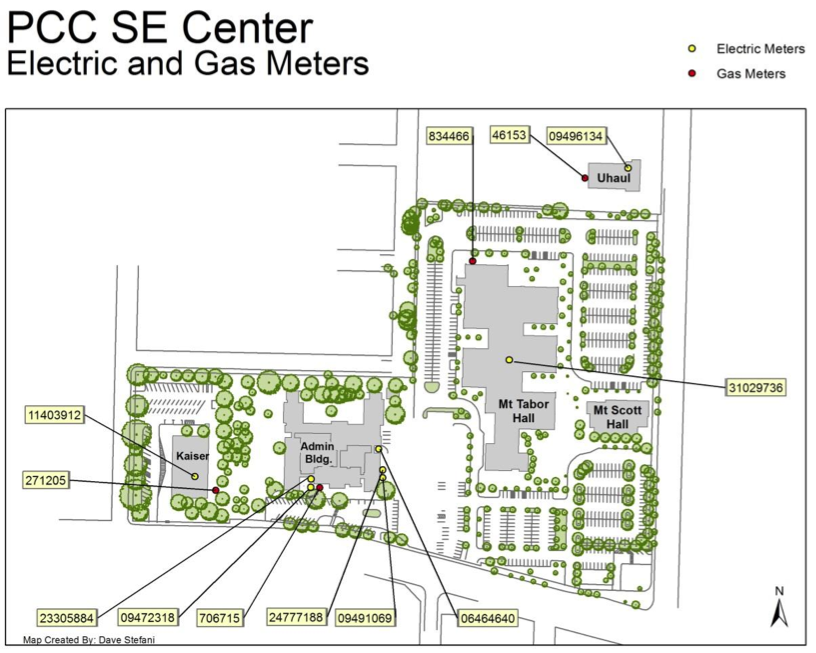
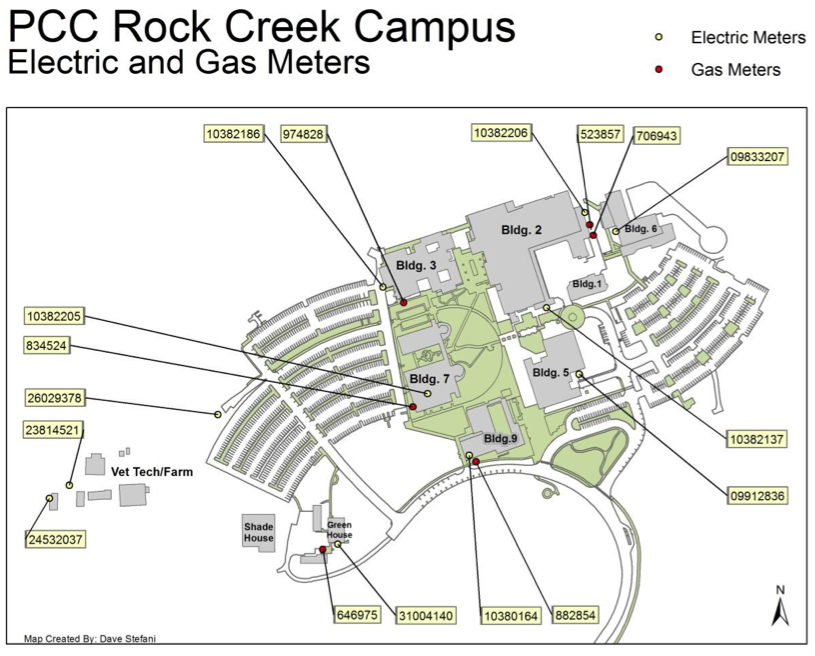
PCC's Office of Sustainability continuously works toward a more sustainable future in all aspects of the college. Included in these goals is the monitoring of energy use on all campuses. In an effort to better understand the energy usage at each building, David Stefani created a series of maps showing the location of electric and gas meters for Sylvania, Cascade, Southeast and Rock Creek campuses, as well as tables matching each meter number to a particular campus and building. The maps and their associated tabular data, provide both a written and visual reference for energy meter location and service that can be used to identify any red flags in energy consumption. For instance, if a particular meter number consistently shows high usage, a quick reference to the location and associated building might show why the energy consumption is high, or may indicate a need for a retrofit to bring the building up to current standards. David used GPS to collect all the meter data and converted CAD data for the campus maps.

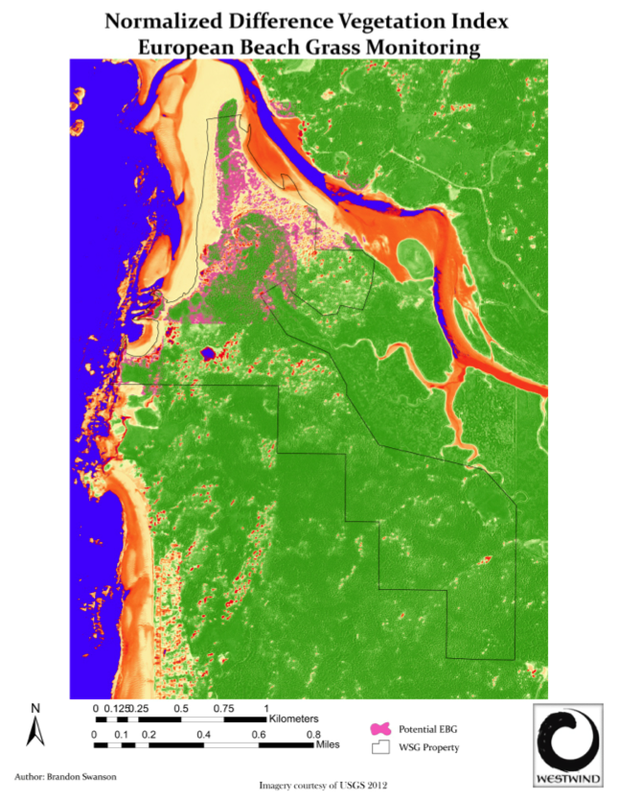
Westwind Stewardship Group
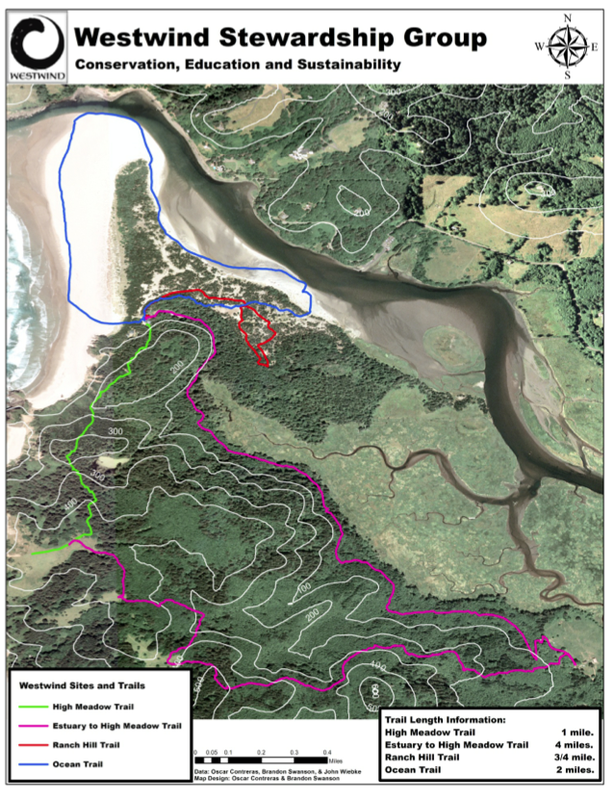
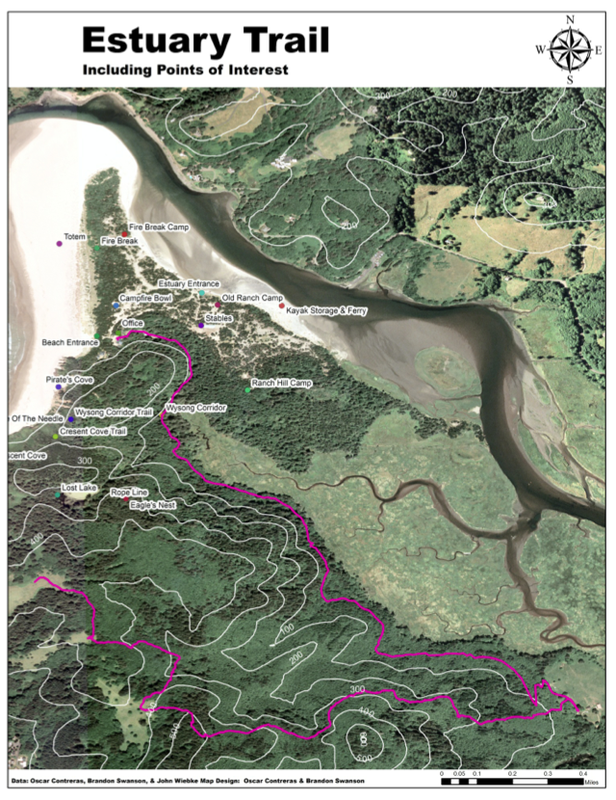
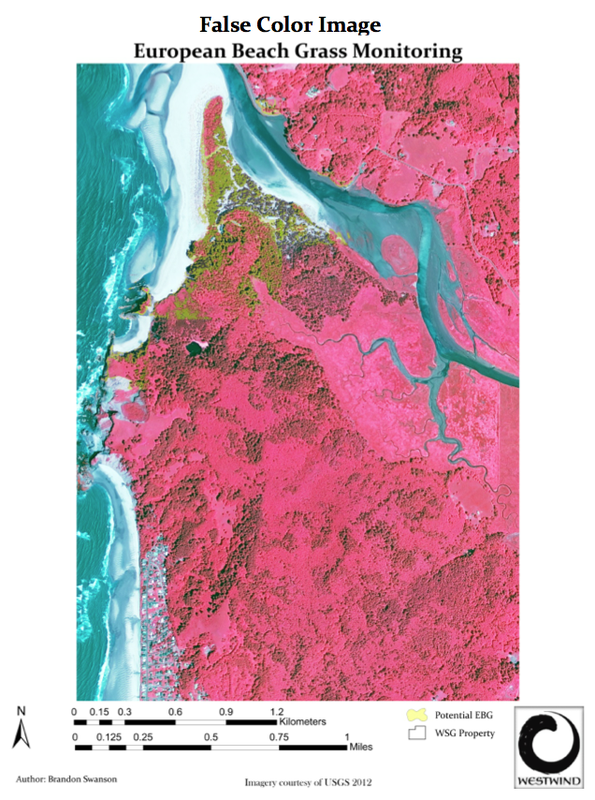
The Westwind Stewardship Group (WSG) asked Brandon Swanson, Oscar Contreras, and John Wiebke to update the the trail maps, use remote sensing to identify invasive plant species and to create web based maps for their website. Accurate maps of the trails are an important tool for WSG’s management and participants and web based mapping is a great way to get people to visit the property. Students went on-site to collect GPS data for all the trails and major points of interest on site. The web-based map can be viewed here: http://mapper2.blogspot.com/
OpenStreetMap (OSM)
Two students worked on creating data for OpenStreetMap, which is a free, open source, worldwide map. Shana Rogers worked with the regional transportation agency, TriMet, who uses OSM as the basis for the Trip Planner tool. Shana inputted and updated data related to curbcuts in order to support the Trip Plans made by users with disabilities or persons needing a smooth service for walking, rolling, or riding. This data will help steer people away from areas that are unsafe and/or inaccessible while still providing reasonably efficient routes.
Danny Jenks contributed to OSM and specifically the OpenCycleMap for Boise, ID. There was little to no data for Boise in terms of Bike lanes or transportation routes. Danny used information from Ada County, Google Maps, and Bing Imagery to update the information.
To view the data in OpenStreetMap go to: http://www.openstreetmap.org/ or use the Trip Planner tool on TriMet's website: http://trimet.org/go/cgi-bin/plantrip.cgi
UN Regional Center of Expertise (proposed)
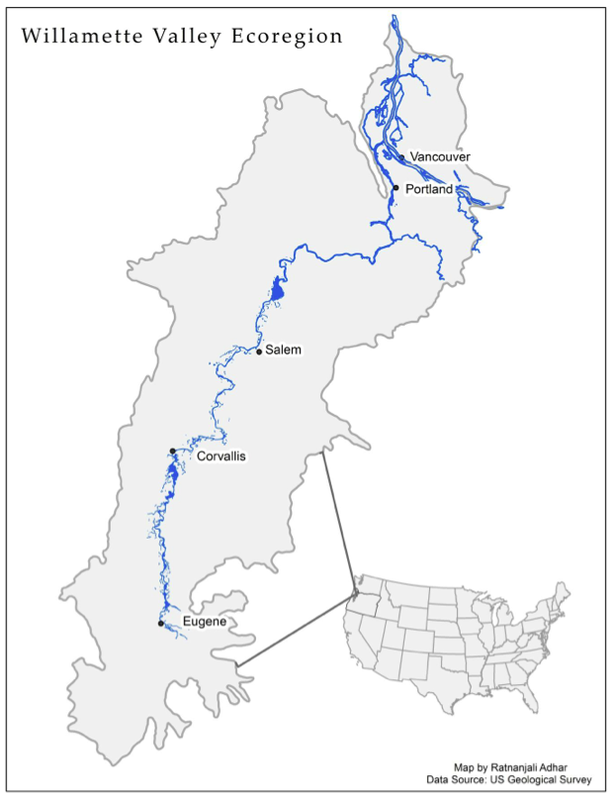
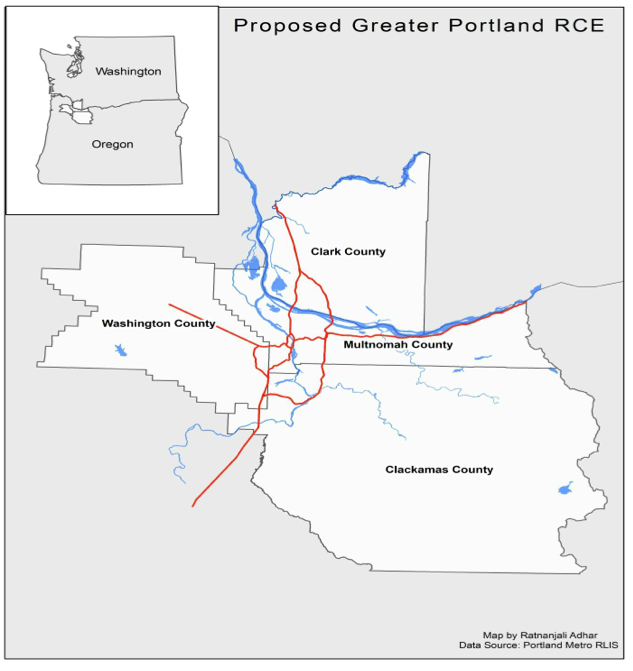
The Greater Portland region is a global leader in sustainability education owing to the huge number of people and organizations doing innovative work in the field. Recognizing the abundance of sustainability education work happening in our region, a group of teachers, students, non-profits, government agencies, businesses and community leaders is applying to the United Nations University system to be designated as a Regional Center of Expertise (RCE) to help support collaborative efforts in education for sustainable development (ESD). Ratna Adhar and Peter Rugh worked with this network of people and organizations to create geographic tools (web-based map, Green Map) and maps to formally apply to the United Nations as a RCE.
The web-based map of Sustainability Providers can be found here: http://www.pcc.edu/about/sustainability/regional-center-expertise/get-involved/map.html.
The Green Map that was created can be found here: http://www.opengreenmap.org/greenmap/greater-portland-center-expertise
The web-based map of Sustainability Providers can be found here: http://www.pcc.edu/about/sustainability/regional-center-expertise/get-involved/map.html.
The Green Map that was created can be found here: http://www.opengreenmap.org/greenmap/greater-portland-center-expertise
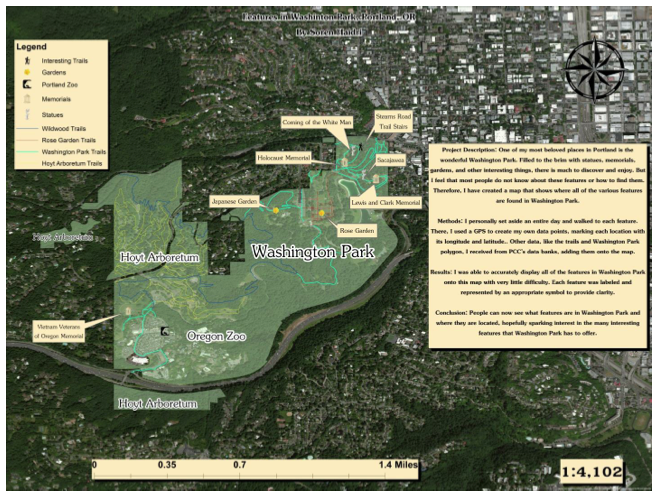
Washington Park
Soren Haidri has a certain fascination with Washington Park in Portland. He choose to create a map which displays all the features of the park including statues, memorials, gardens, and other points of interest. Soren created his own data using a GPS receiver and walking the park to collect points, lines, or polygons for the features on the map.
Tualatin Hills Parks & Recreation District (THPRD)
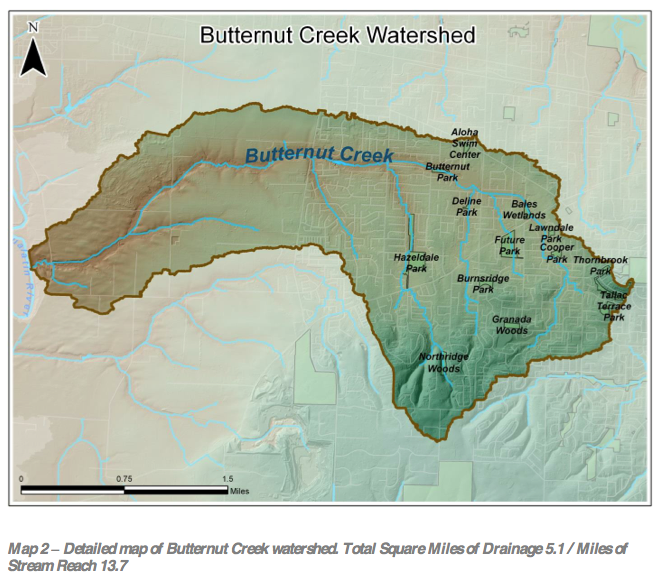
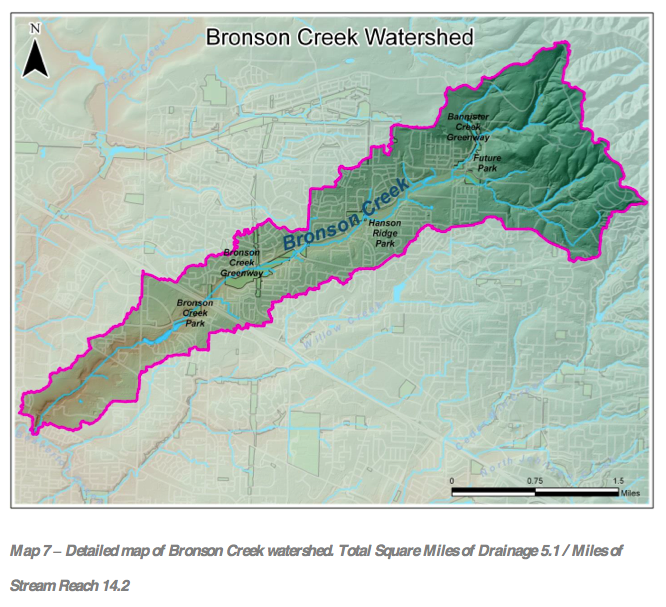
Scott Hinderman worked with the Tualatin Hills Park & Recreation District to delineate drainages found within the district. The THPRD Natural Resources Department was also interested in a more detailed stream layer to see possible seasonal streams and ditch lines that hold water throughout the various parks. Scott worked with LiDAR data of the district to determine the location of drainages and associate them with existing parks, length of stream miles, size of drainage areas, and develop an effective way to use the information within the District and for the public. Maps were created for the District as well as for educational programs offered within the District. 11 maps were made in total - 3 are shown below.

Friends of Trees
Jessi Mons worked with Friends of Trees to take their available data (dated as far back as 1989) to create a visualization displaying all the trees they have planted through their Neighborhood Trees Program. The Neighborhood Trees Program specifically enables homeowners to buy trees at a discounted rate and plant them with their neighbors at neighborhood planting parties, organized by Friends of Trees. The majority of these trees have been planted in the Portland metro area, with a small concentration also in the Eugene-Springfield area. The date range provided was from 1/1/1989 to 4/20/2013 and included 28,289 unique addresses and 47,057 total trees. Below is the visualization that Jessi created using the geospatial data.
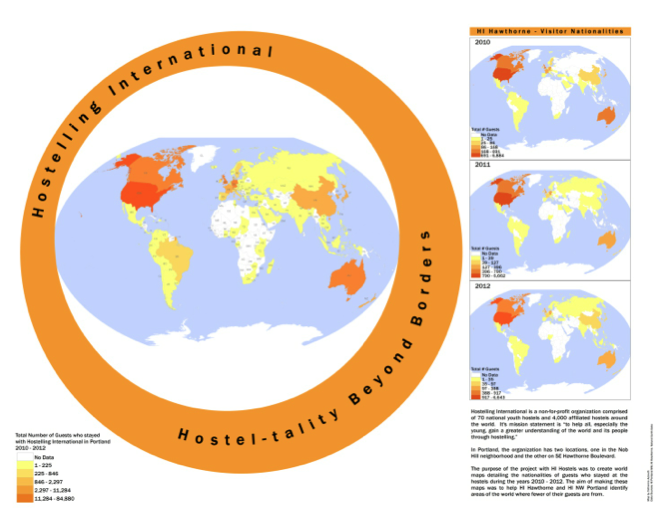
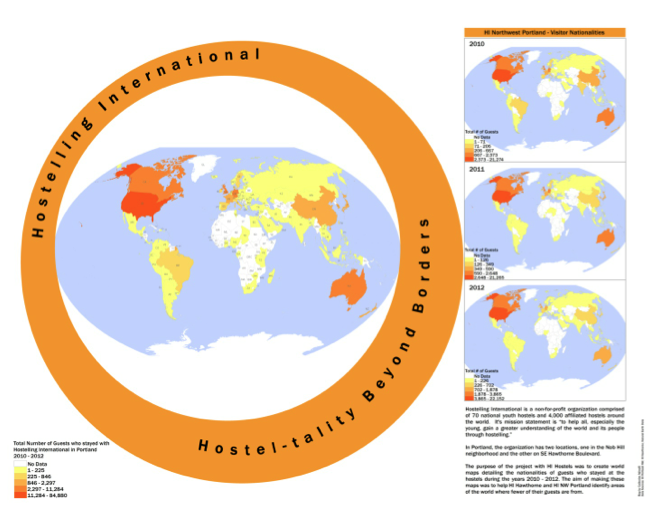
Hostelling International, Portland
Hostelling International (HI) is a non-for-profit organization comprised of 70 national youth hostels and 4,000 affiliated hostels around the world. Its mission statement is “to help all, especially the young, gain a greater understanding of the world and its people through hostelling.” The organization has two locations in Portland, one in the Northwest neighborhood of Nob Hill and the other on SE Hawthorne Boulevard.
Catherine Adinolfi worked with HI to map where their visitors came from in 2010, 2011, and 2012. HI also wanted to know the bigger picture, meaning how many visitors to Portland chose to stay at a HI hostel in 2010 – 2012, where were they from and where they were not coming from. This was accomplished by creating four maps for each hostel to be displayed on a 36” x 48” poster.
Catherine Adinolfi worked with HI to map where their visitors came from in 2010, 2011, and 2012. HI also wanted to know the bigger picture, meaning how many visitors to Portland chose to stay at a HI hostel in 2010 – 2012, where were they from and where they were not coming from. This was accomplished by creating four maps for each hostel to be displayed on a 36” x 48” poster.