|
Written by JJ Bjordahl Do people who want animated maps have to know crazy web-code magic spells to make their maps move? NO! You can time enable your data in ESRI products and here are some ways how! Have you ever noticed under feature class properties in Arcdesktop that there is a Time tab? See for yourself below… 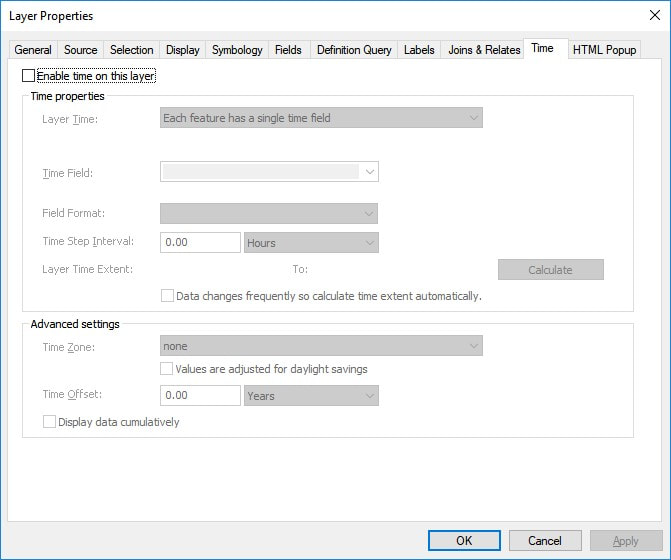 Well if the data you upload onto AGOL has time references you can enable those too. Let’s try~ For an example I’ve prepared a simple data set (i.e. coordinates and time) which you can download as a comma separated value file (*.csv). Note: you must be logged into your PCC.edu Gmail account to access the Drive shared file. Get the time referenced example data here --> https://docs.google.com/spreadsheets/d/1MXtSnAH-keHCp7dzP6CY3etvF7KD_yPjlEeZB1qyCD0/edit?usp=sharing The *.csv has three columns Lat, Long, and Time. If you’re not already logged into AGOL and in your Content section go ahead and do that… while in your AGOL Contents you can ‘+ Add Item… from my computer,’ so add the example *.csv. 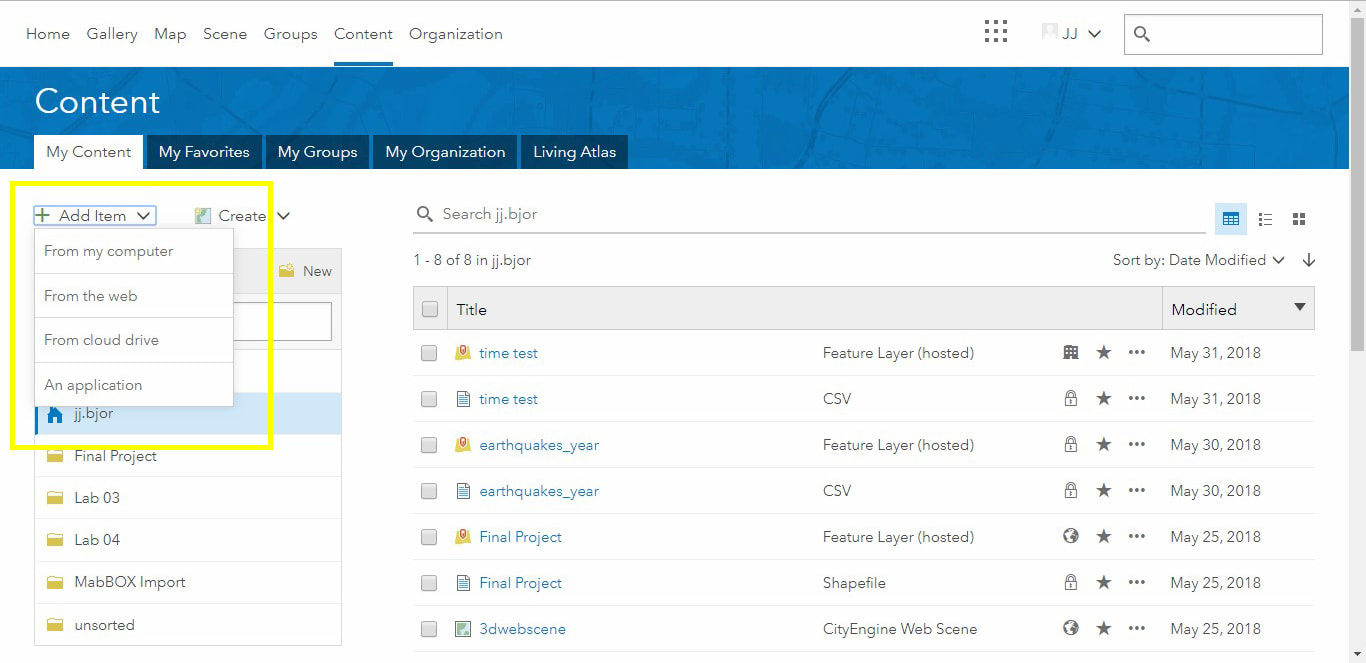 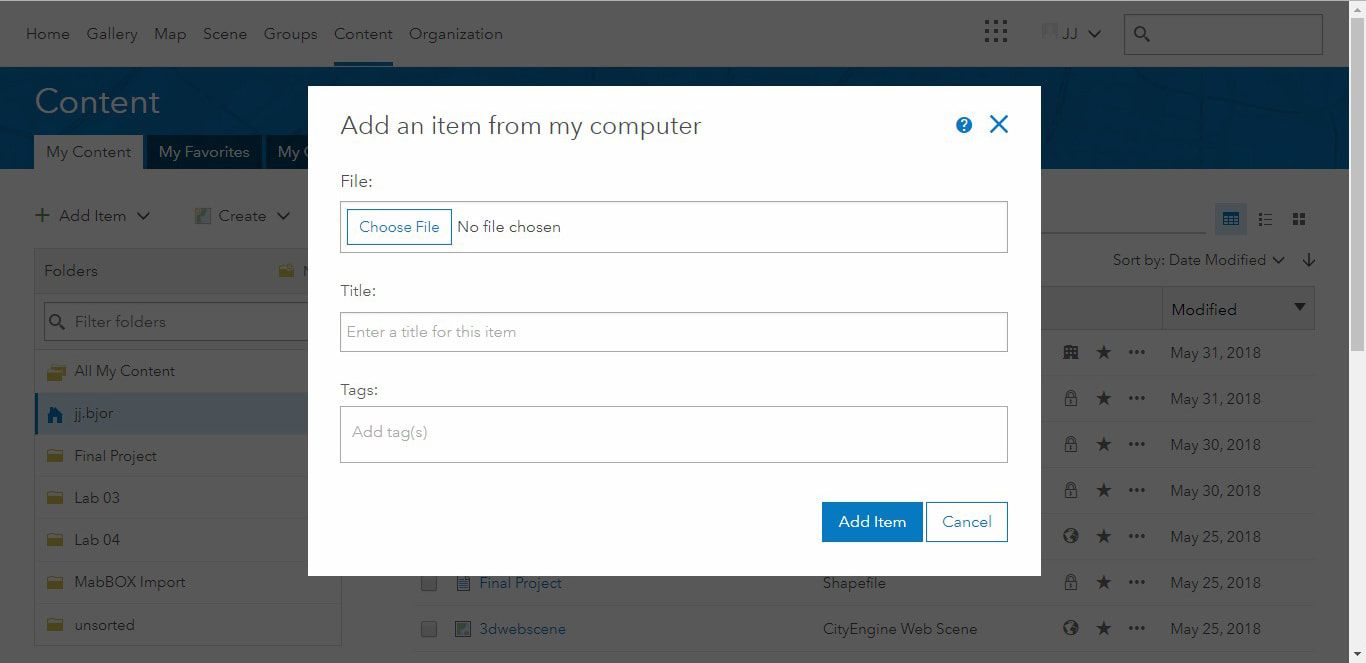 We need to ‘Host’ via PCC’s AGOL relationship so ‘Share’ the csv with PCC so it becomes ‘Hosted.’ 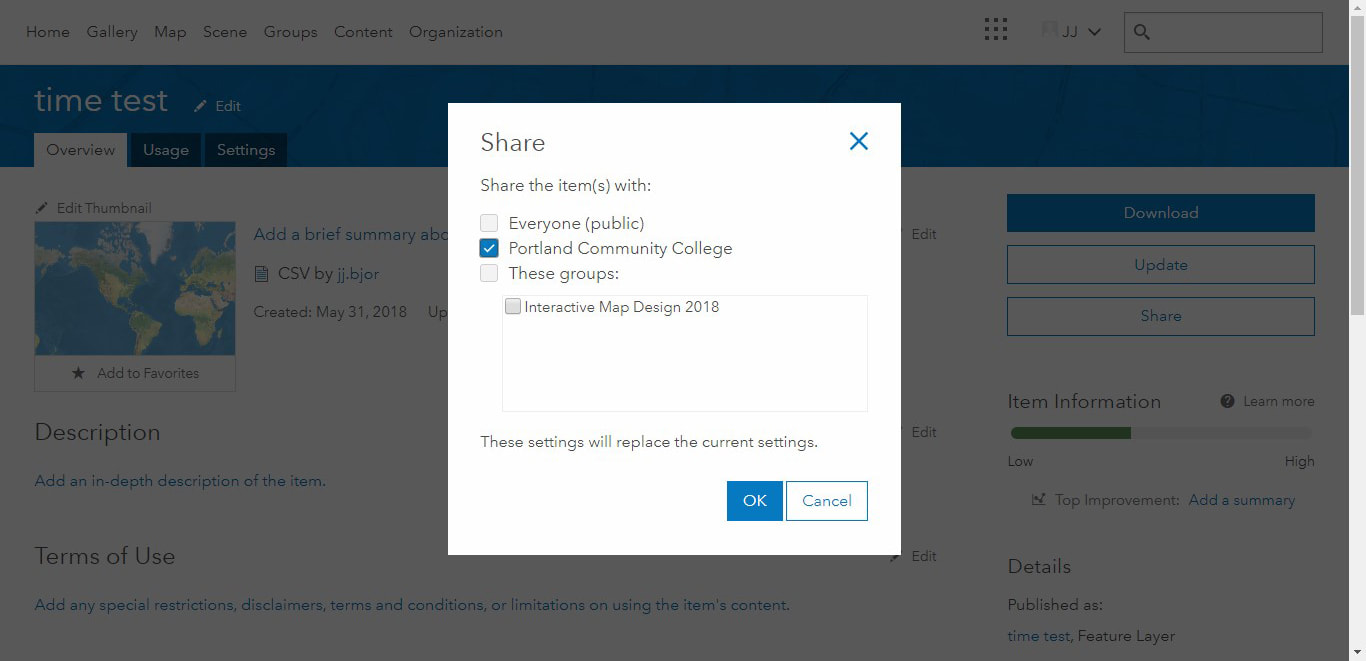 Now check in ‘Content’ to see that our file show as a ‘Feature Layer (hosted)’ 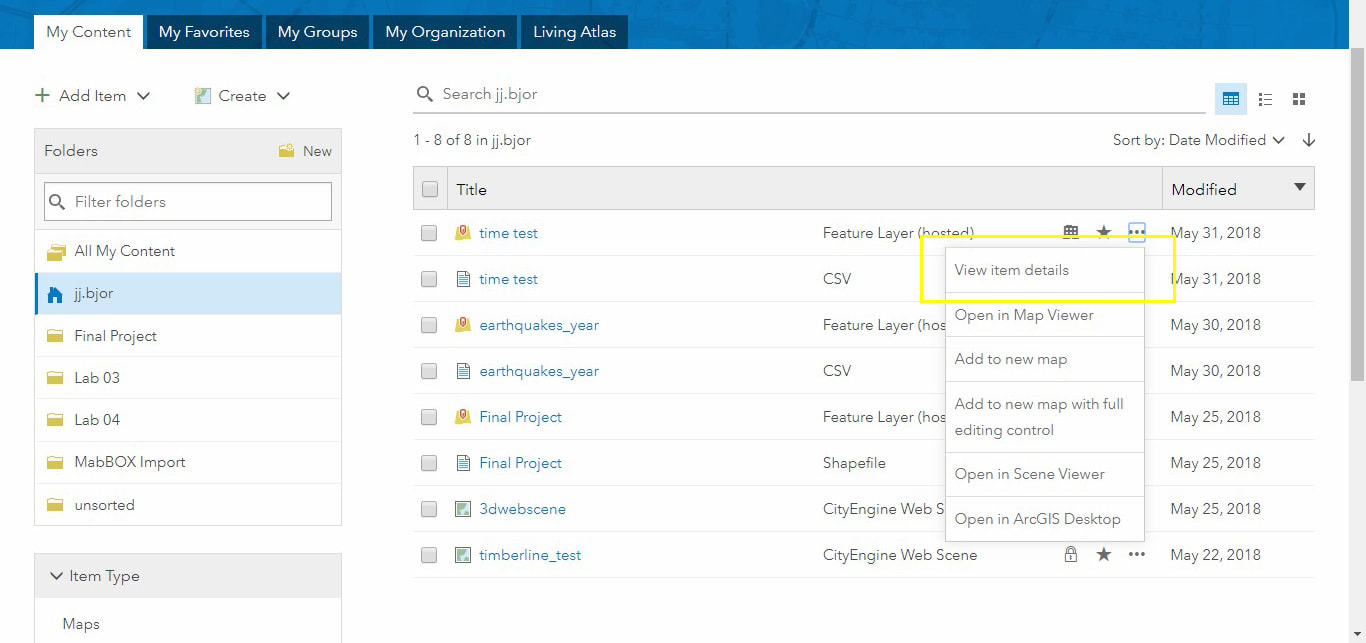 and then click into the file’s ‘Item Details’ and go into Time Settings… The csv I provided has a single time reference for each data point and thus not a start and end time… 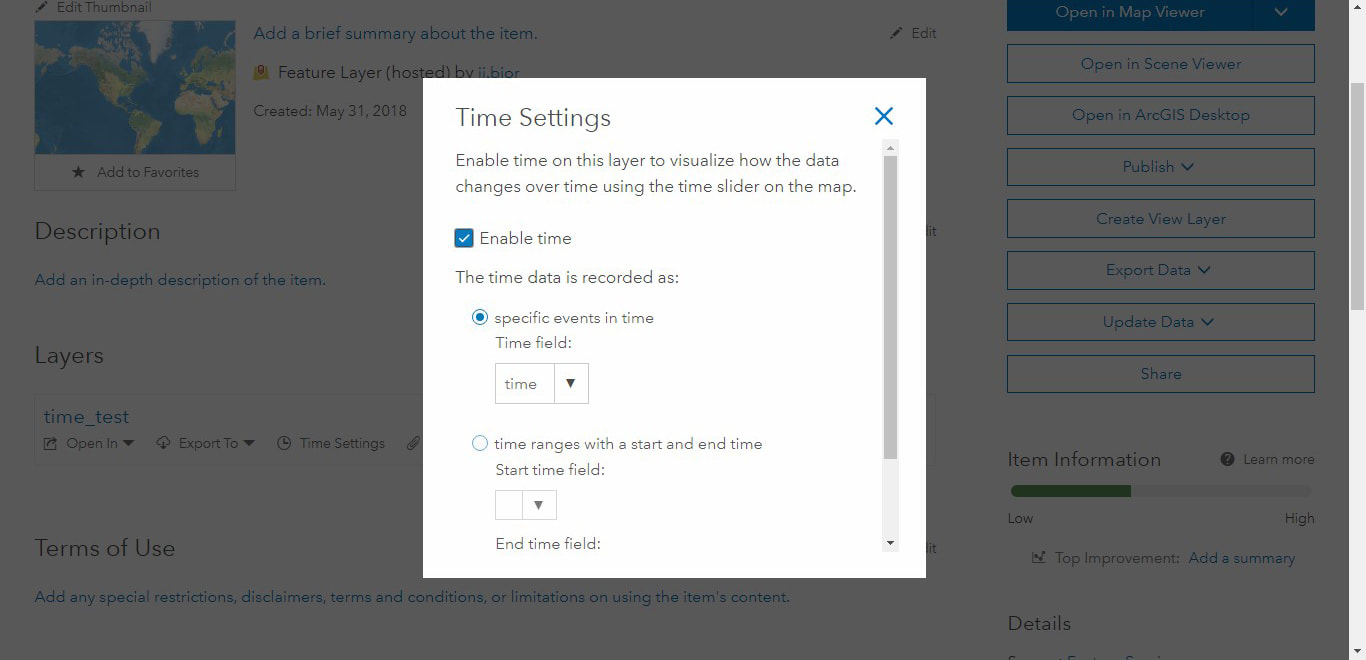 Now that time is enabled (if it ain’t… hmm… uh… hmmm… maybe start over? It ought be!) open the hosted file in MapViewer and you’ll notice there’s a time slider with configurable options at the bottom of the map! 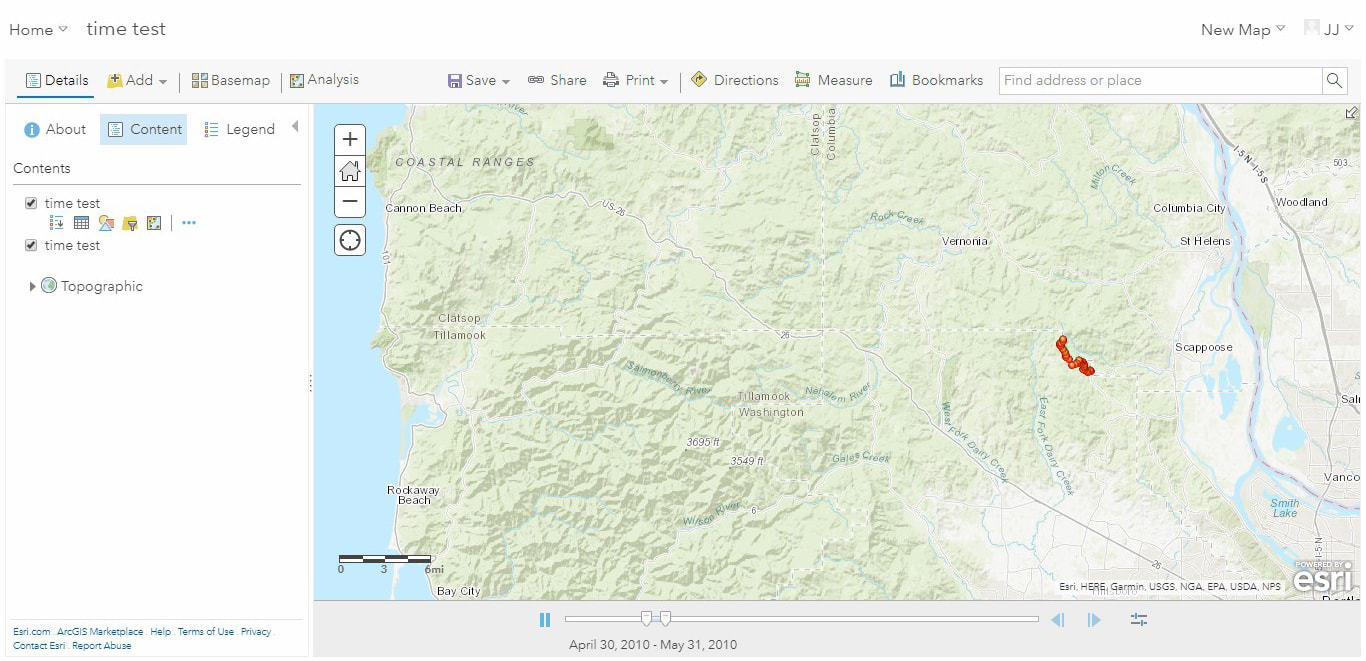 Now you can change the rate at which the data is displayed, the amount of data displayed per segment, to add the points as time progresses or only show points within a set time frame etc… I set the speed to fast and in ‘advanced options’ set the interval to display in monthly chunks and now my points look like an ancient cell phone worm game crawling across Oregon.
3 Comments
Thyra Bishop
6/4/2018 05:16:00 pm
This is great! I'm recommending my community partner, Mercy Corps, get a student in Spring 2019 to do maps like this. Thanks!
bob nicholas
6/12/2018 01:59:29 pm
JJ, 6/12/2018 08:21:15 pm
Hi JJ, Leave a Reply. |
AuthorBlog posts are written by students in the Interactive Map Design course at Portland Community College. Archives
June 2018
Categories |
 RSS Feed