|
Written by Baxter Shandobil For my final project, I am working with The Northwest Earth Institute, an environmental non-profit here in Portland. Each year they host an “Ecochallenge” that encourages people to choose one simple action to reduce their impact on the environment, and stick with it for the duration of the challenge. The 2016 edition had over 8500 participants from around the world. I was tasked with creating a map to demonstrate the breadth of the worldwide participation, and was given a CSV with the name and location of each participant. Unfortunately, these locations were not geocoded. For that reason, in addition to the fact that they wanted an easily reproducible map, I decided to use Tableau to make my web map. Tableau has a feature that will automatically geocode address for you. The software indicates that it has recognized city, state, and country fields as locations by putting a little globe icon next them as seen below. Just drag and drop into the box that says “Marks.” 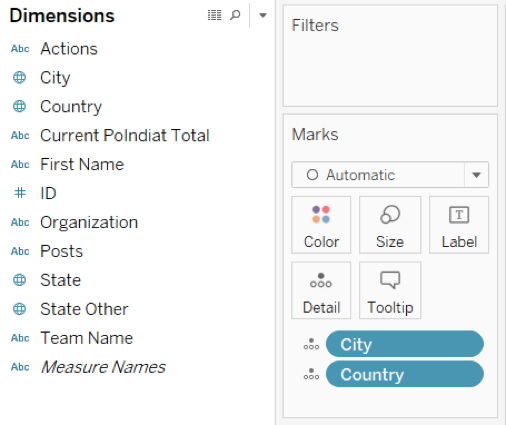 Simple right? Or so I thought… But here is what happened when I dragged City and Country into my worksheet: 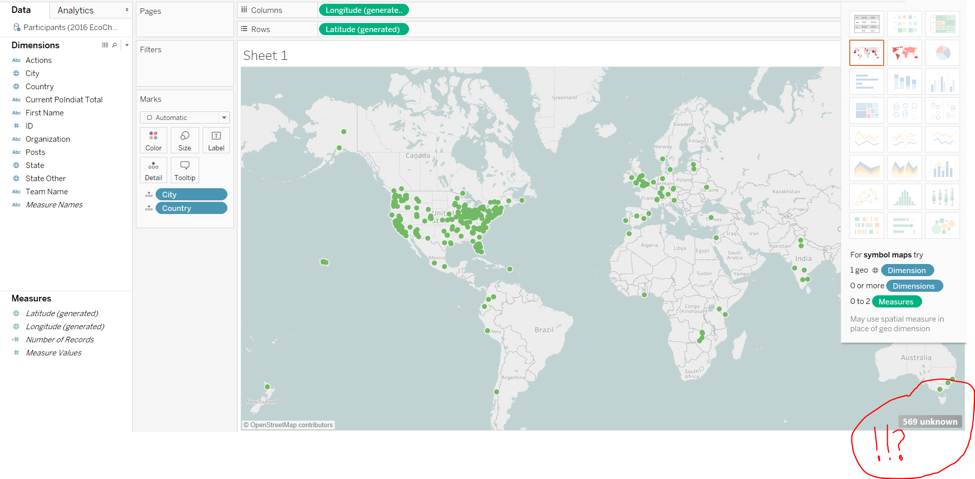 569 Unknown Locations??? Okay, so let’s try adding the states in to see if that helps: 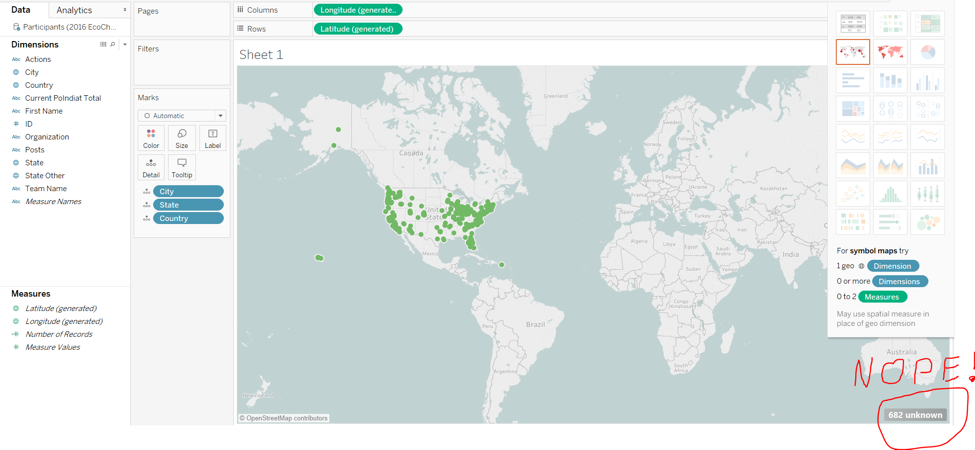 In addition to their more unrecognized locations, adding the “States” field confused Tableau further and all the International points disappeared from the map. I attempted to resolve this a few ways:
After all that, I realized that it actually is possible to export the coordinates back out to a CSV, I just did not dig deep enough on how to do it. I had spent so much time diagnosing the issue that I just wanted to power through and get it done. For future reference here is how to do it: 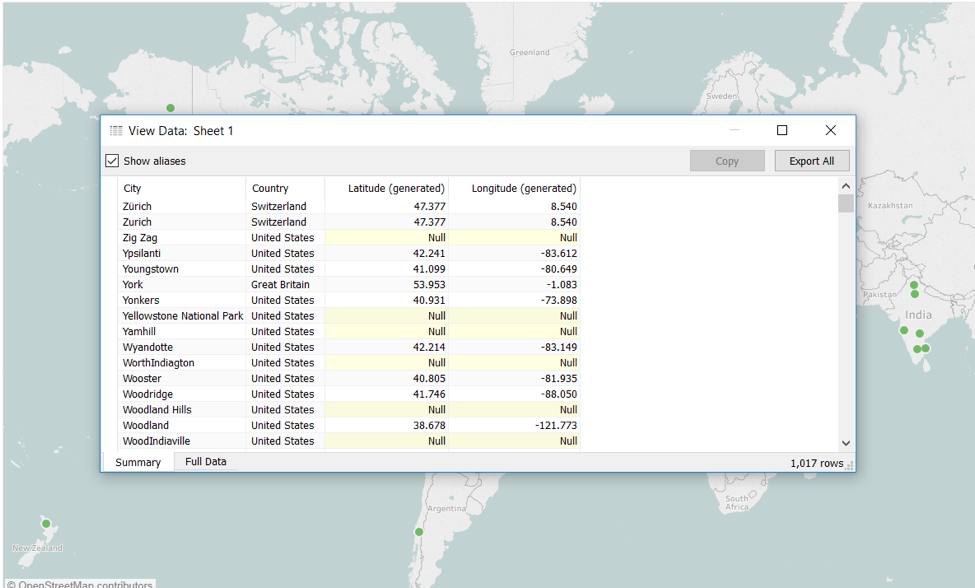
1 Comment
Kaitlin Sagdal
6/13/2017 12:17:42 pm
Baxter, Leave a Reply. |
AuthorBlog posts are written by students in the Interactive Map Design course at Portland Community College. Archives
June 2018
Categories |
 RSS Feed