|
Written by Erin Miller
In the age of ever expanding Internet use, data collection (open source or private) and subsequent map visualizations via Internet mapping technologies, such as Google, the concept of ethics in web mapping applications becomes vitally important in protecting the integrity of online cartography. A good starting point for this discussion is the Code of Ethics provided by the GIS Certification Institute (1). This document describes some basic ethical guidelines to consider as a GIS professional. The most important of which is the understanding of how our map products may directly impact society and individuals. Large scale Internet use allows maps and data to spread like wildfire across the entire world in a matter of seconds. A poorly designed online map, or one that intentionally or unintentionally leaves out data, made public can have unintended consequences if misinterpreted or misused. A new dilemma arises from the proliferation of online mapping platforms, especially open source, where cartographic novices can add to the wealth of information on the web. OpenStreetMap allowed anyone in the world to add their local spatial information. The ethical question involved with this is who is responsible for the resulting map product (2)? How is the map going to be used? What are the motivations of the users adding (or subtracting) data to these open source maps? A final consideration in the use of interactive web mapping is the addition of non-spatial data to online maps. When using Google Earth or Google Maps online users can input photos and comments directly into their maps. The ethical concern with this deals with copyright protection and the quality of the comments being added as information to the maps (3). Another concern involves the identification information displayed in Street View within Google Earth. An unsuspecting person photographed as the Google team drives by is now identified and their privacy unprotected. As useful and convenient as Google Maps and Google Earth is, are we unintentionally giving up some of our basic rights as a society? How much information is too much information? My own thoughts on the subject deal mostly with the implications of online mapping on societies and how the information presented in online maps can be grossly misused by corporations, governments, and others. Once we publish a map online we don’t really have much control in how it is interpreted by other users of the map (or subsequently manipulated for other purposes). If at some point we end up working for a corporation that utilizes online web mapping technologies, are we providing skewed visualizations that favor a particular viewpoint. I feel as future GIS professionals we have an obligation to really consider and think about our online maps (or any GIS product for that matter) and maintain as much professional integrity in our final products as we can.
4 Comments
Written by Ian Amitin
I woke up and did what I assume most Americans do to start the day; I checked my phone. I’m not proud of this habit. The routine of checking my phone involves a look at the latest news from NPR. My eyes opened just a little bit wider when I read the headline of the second article down: “Maps Show A Dramatic Rise In Health Insurance Coverage Under ACA.” Ah sweet, a temporal map! thought this nerd, as I examined the article glowing in my face. Indeed, it was a temporal map of the rate of insured per capita by county of the United States. This find was particularly timely because I had been looking for interesting temporal web maps for a couple of days with little to show for it. This map was simple. It had a time bar, and told a simple story. Perfect for mass consumption. I need to make one. So I researched… … And researched… … And then tried an exercise. Finally feeling confident, I decided to try to make the simplest of time enabled web maps... and got nowhere. I was stuck in a cycle of google searches, failed ArcMap table joins, AGOL not giving me an option to enable time functionality, and swearing to myself for days. In cases such as the one I found myself in, I have a method to get myself out. I go to the boxing gym, punch things, get punched, feel better, then go back to work the next morning. Low and behold it worked. I guess my sparring partner knocked some sense into me and I recognized that I was going about my table join the wrong way. I needed to perform a one-to-many join, instead of the standard table joins and appends that proved worthless in this situation. I ended up using the Make Query Table tool to complete a Join of US median income data by year with a simple polygon shapefile of the United States. 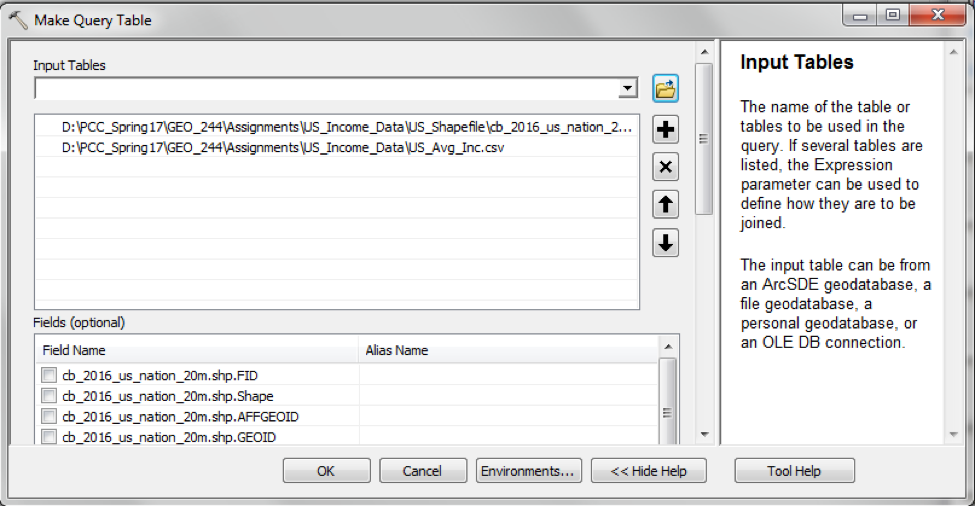
Although the join seemed to work, the names of my output attribute table fields had changed. The field that used to be called ‘Date_’ was now called ‘IncomeB’… Why, Arc, why?!
I knew from my research that I had to enable time on my layer by opening the layer properties and navigating to the ‘Time’ tab, then clicking ‘enable time on this layer’. 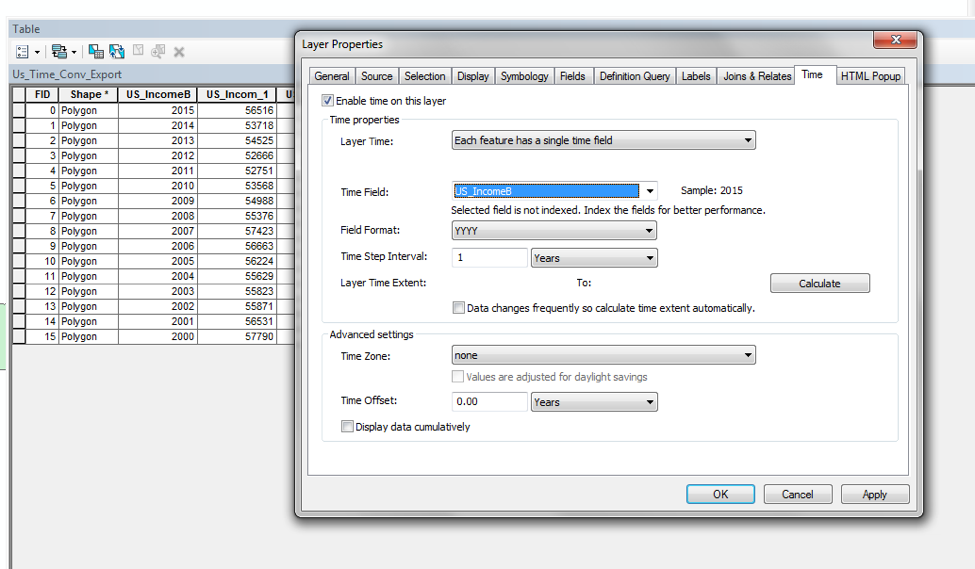
As it turns out, this step is only important for making a time-enabled map within ArcMap. What was truly important was formatting my time field so that ArcGIS Online can understand that this layer contains time data. To do this, I used the Convert Time Field tool.
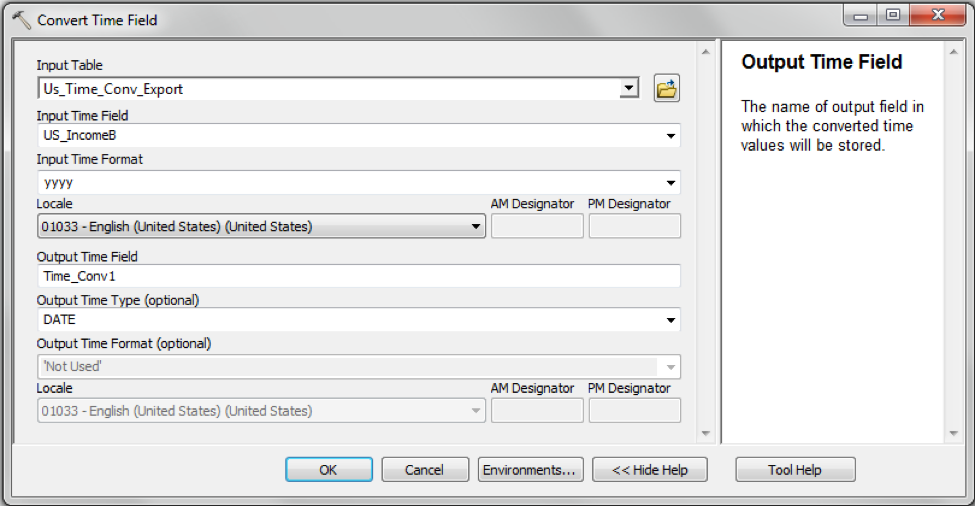
This gave me a new field that I named ‘Time_Conv’.
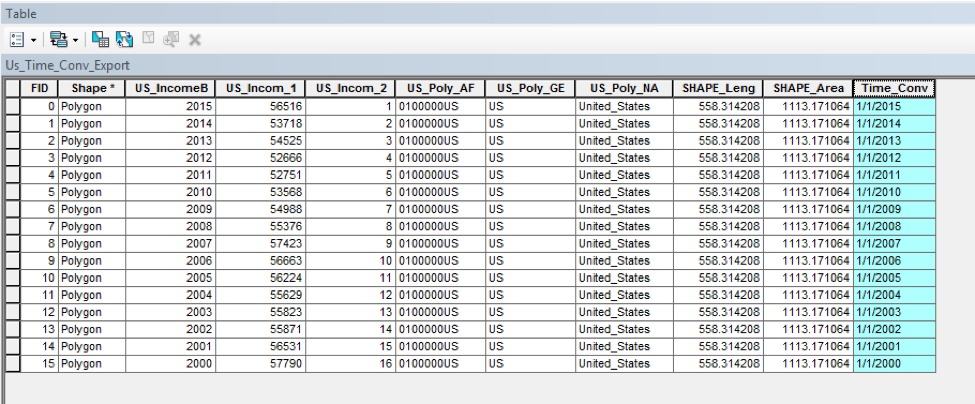
With my data now formatted to be recognized in AGOL as containing time, I exported my data into a new folder and then compressed that folder, because AGOL can only upload shapefiles in .zip folders.
Finally, I was ready to make my temporal map in ArcGIS Online. I started by uploading my data into the ‘My Contents’ section as a Hosted Feature Layer. It was very important for me to upload data as a Hosted Feature Layer, otherwise AGOL would not recognize that my data contained a time attribute. We are able to do this because PCC now has hosting privileges. 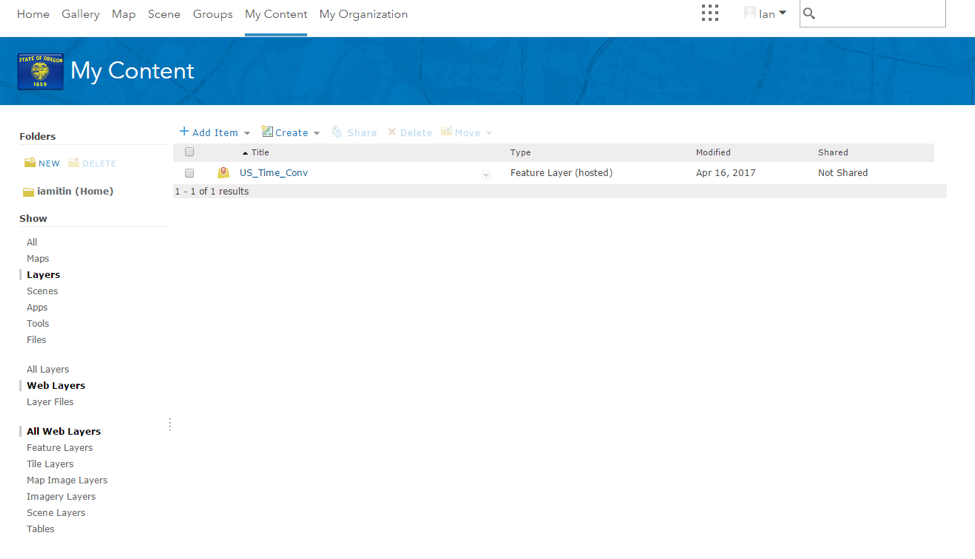
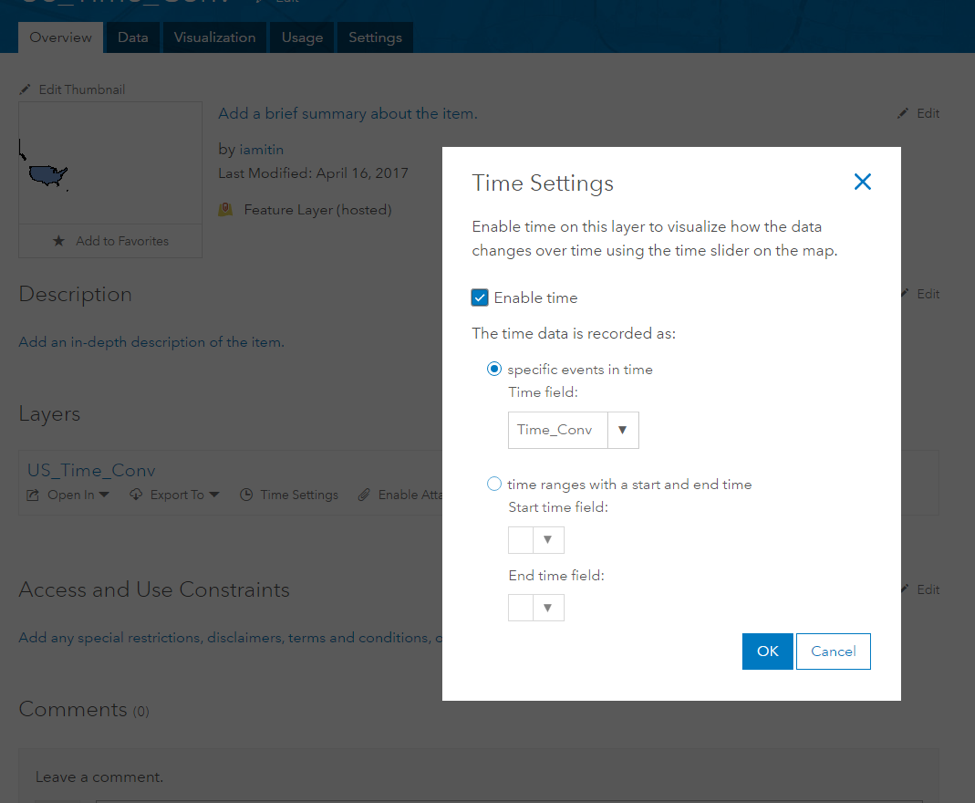
With my data hosted in AGOL, I clicked on my file name and enabled my time settings.
After time settings are set, making a map in AGOL was easy and intuitive. I modified the thematic characteristics of my map by clicking Details > Change Style, and then selecting an attribute and display theme. I selected my attribute for Annual Median Income (‘income1’) and made a simple 5-class choropleth map using natural breaks to classify significant changes year over year.
At the bottom of my map I found a time bar and small button to the right that will allowed me to configure my time bar settings. 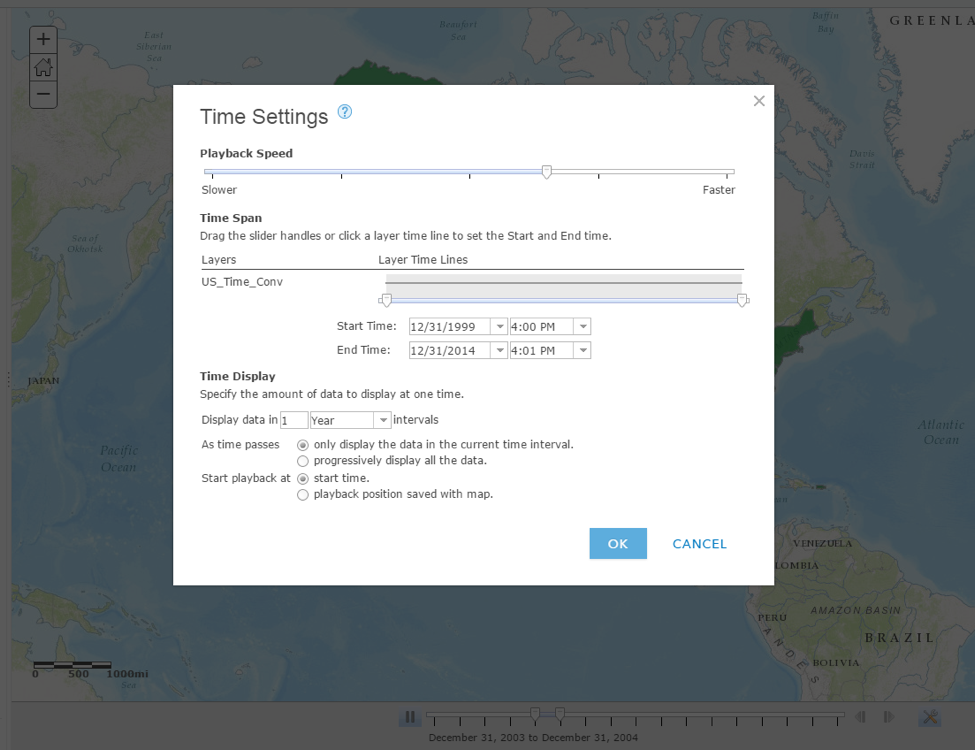
While less than great, I had finally built a temporal web map! I high-fived everyone in the tutoring lab.
My experience in making the simplest of temporal web maps was frustrating, but like trying most GIS tasks for the first time, now that I have made it work once, I feel much more optimistic about making better maps in the future. My first temporal web map. Open Source Interactive Mapping: A Rudimentary Introduction to the QGIS2WEB Plugin for Quantum GIS4/14/2017 Written by Eddie Curran QGIS2Web is a QGIS plugin which allows the user to export a map created in QGIS to an openlayer or leaflet format webmap. The following is a painfully simplistic tutorial in which the user creates a simple interactive map in QGIS, exports it to webmap format, and opens it in a web browser. First, (after opening the latest version of QGIS) install the QGIS2Web plugin from the "plugins" menu. An icon appears on the taskbar, one icon to the right of the "python" icon. 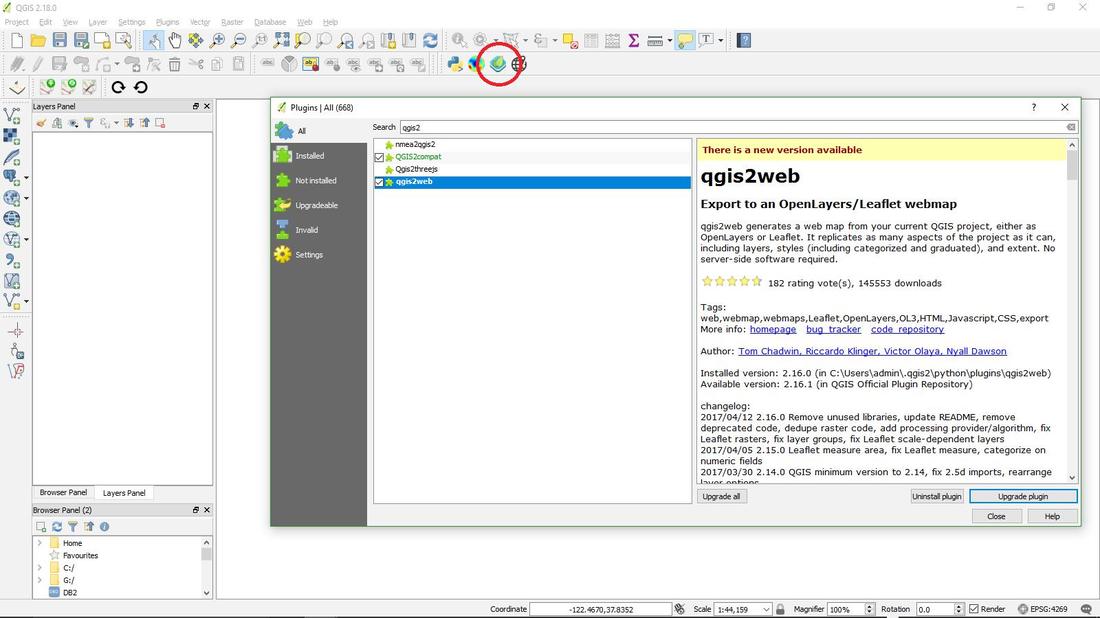 Import layers to QGIS: Select the "add vector layer tab" in "layer" mode and browse for layers. In this case, a Portland neighborhoods layer and major river layer. 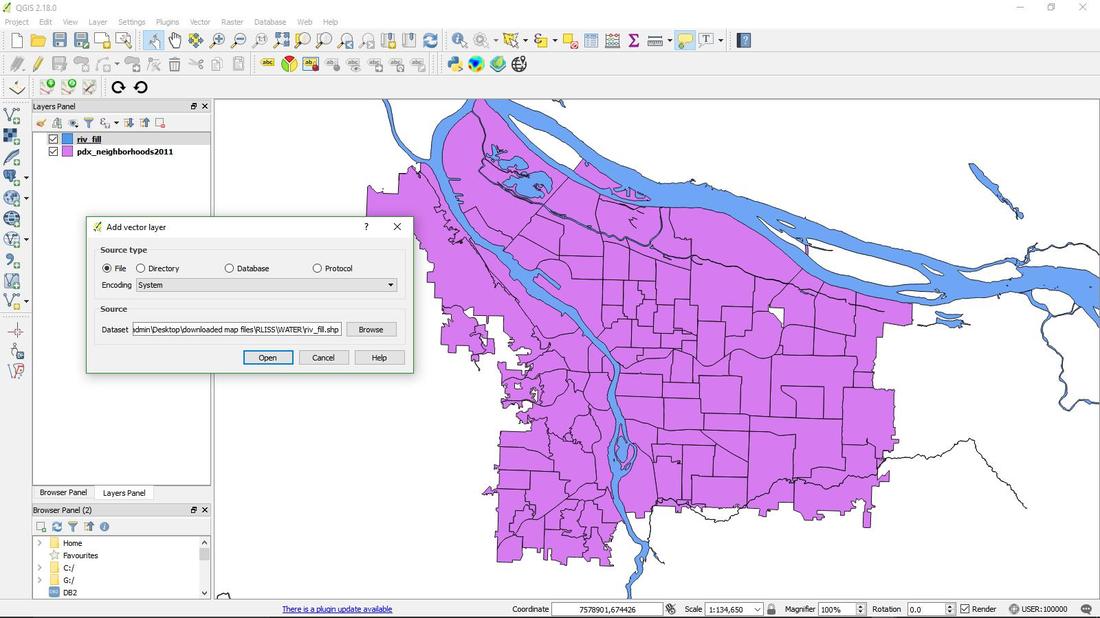 The coordinate system for web mapping in QGIS is EPSG 4326, but this does not reliably work with QGIS2WEB. However, a default coordinate system, called the "User Defined Coordinate System" almost always works when exporting a map with the Q2W plugin. To make basic alterations to the imported layers, double click on their labels in the table of contents, or right click – properties. In this example, "style" is chosen and the neighborhoods are classified using a random color ramp. 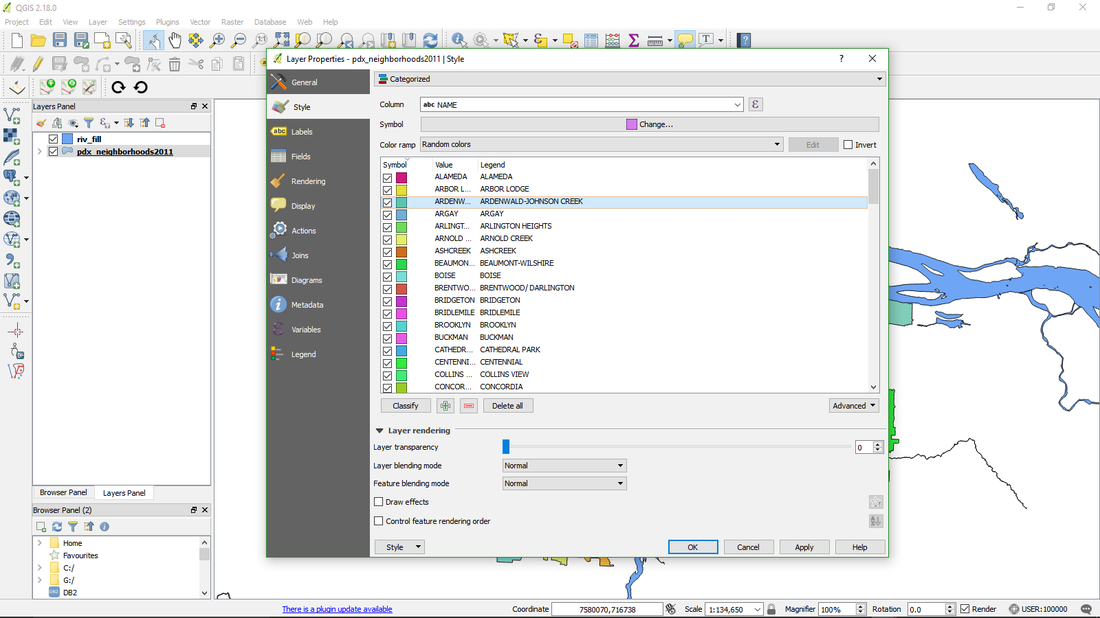 Right clicking on the layer in the table of contents and selecting "Set Layer CRS" will set the coordinate system: one can also click on the "General" tab in the Properties window or find the "Set CRS of Layers" menu item under the "Layers" menu in the main toolbar. Once the layers are ready, just click on the QGIS2Web plugin button and if all goes well a preview window appears with the layers displayed in it: 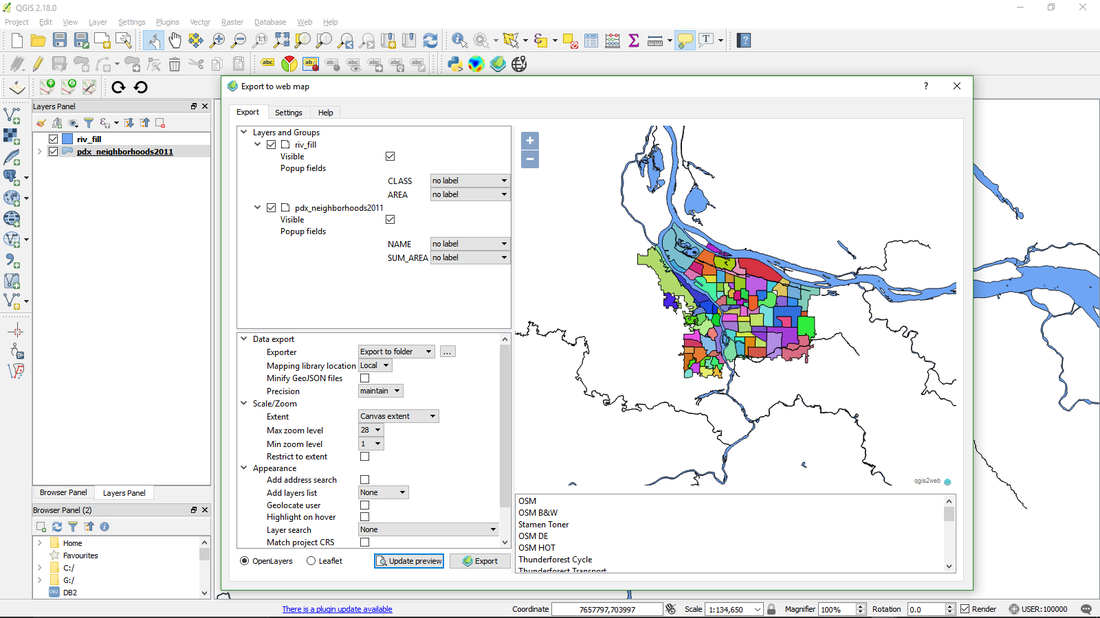 Here you may choose from a variety of menu items to do some basic tweaking of the map. For example, how attribute values appear when counties are clicked on the map, the default scale, whether OpenLayers or Leaflet format, configuration of a search bar, etc. (the actual code is available for alteration once the map has been exported). If the layers do not appear at this point it is usually because there's a problem with the coordinate system/projection: if one layer is in the wrong CRS then none of the layers will appear. This problem can usually be solved by going back to QGIS and changing the CRS (Layer- Set CRS of Layer(s) or Ctrl-Shift-C) to the "User Defined Coordinate System": 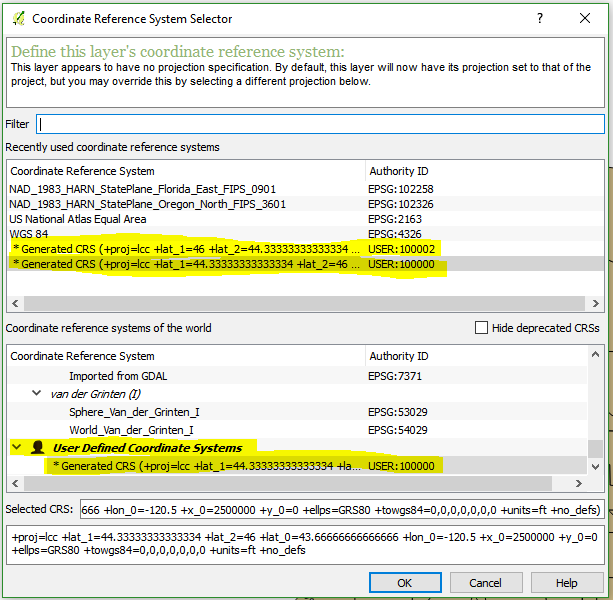 In the lower right corner of the preview window one may choose from a list of basemaps: Selected here is a basic OSM street map. 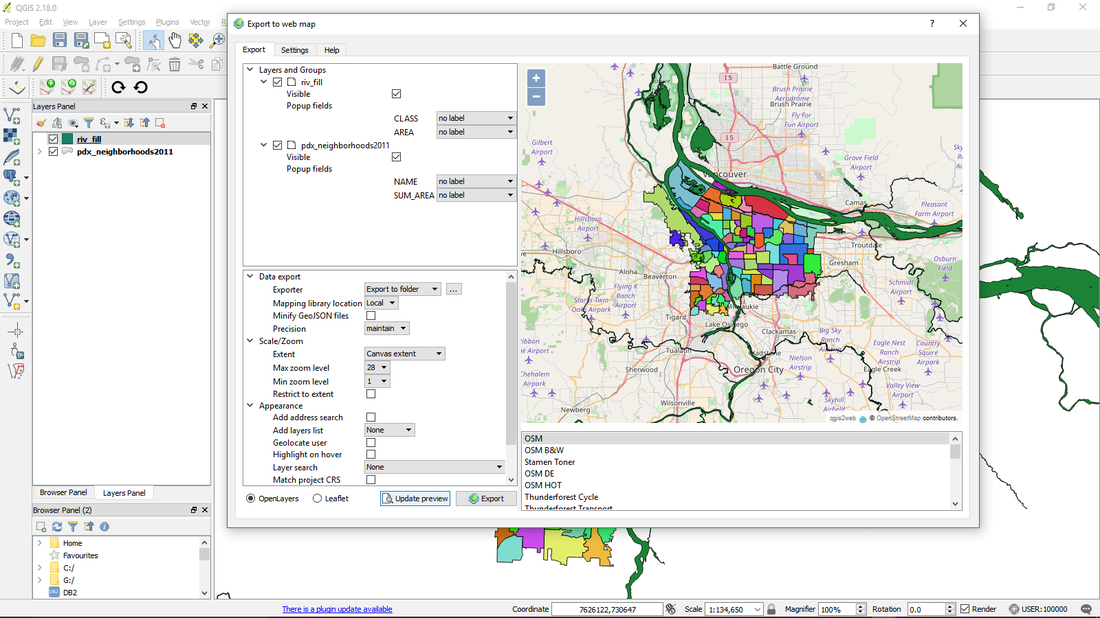 This is a good place to troubleshoot the Coordinate Reference System (CRS) : if the basemap does not line up correctly the layer's CRS need to be changed. (Typically if there is a projection issue the layers won't open up in the preview window at all, but this is another opportunity to make sure they're lined up properly). In the preview window it is possible to see how the map will behave once it is opened up and manipulated in a browser: clicking on the map calls up attributes, zoom and search functions work just as they would when the map goes "live". 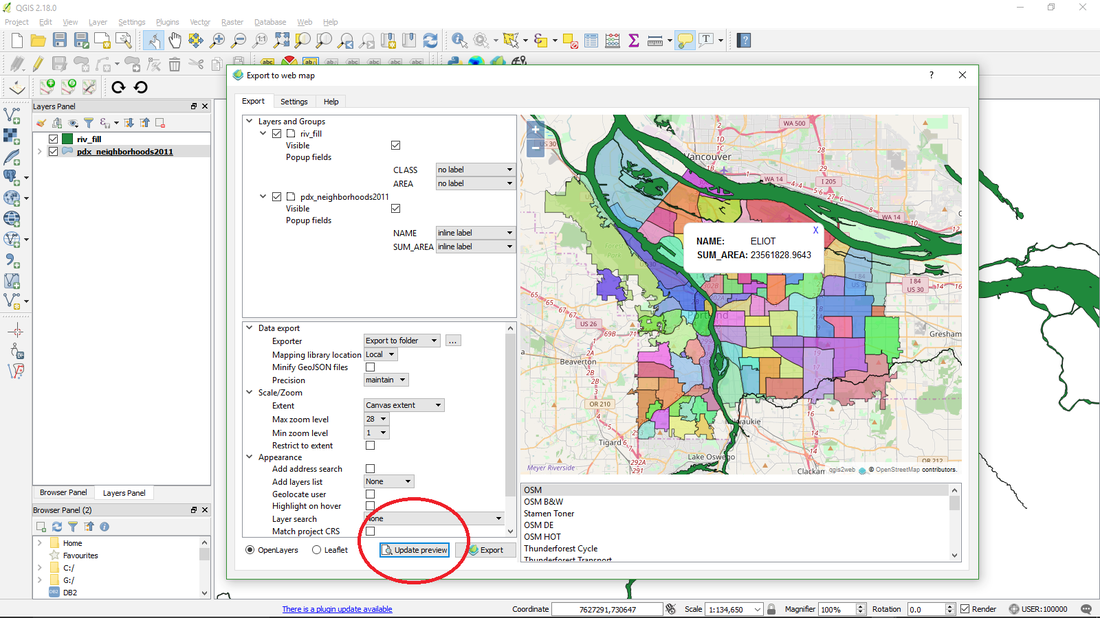 At this step in the process one may go back to QGIS to add and alter layers, or change any of the settings in the preview window. Hitting the "update preview" tab refreshes the now interactive map prior to exporting. Before exporting to webmap, click on Data Export / Browse and decide where to save the map: this determines where the html, css, java, etc. files will be stored: 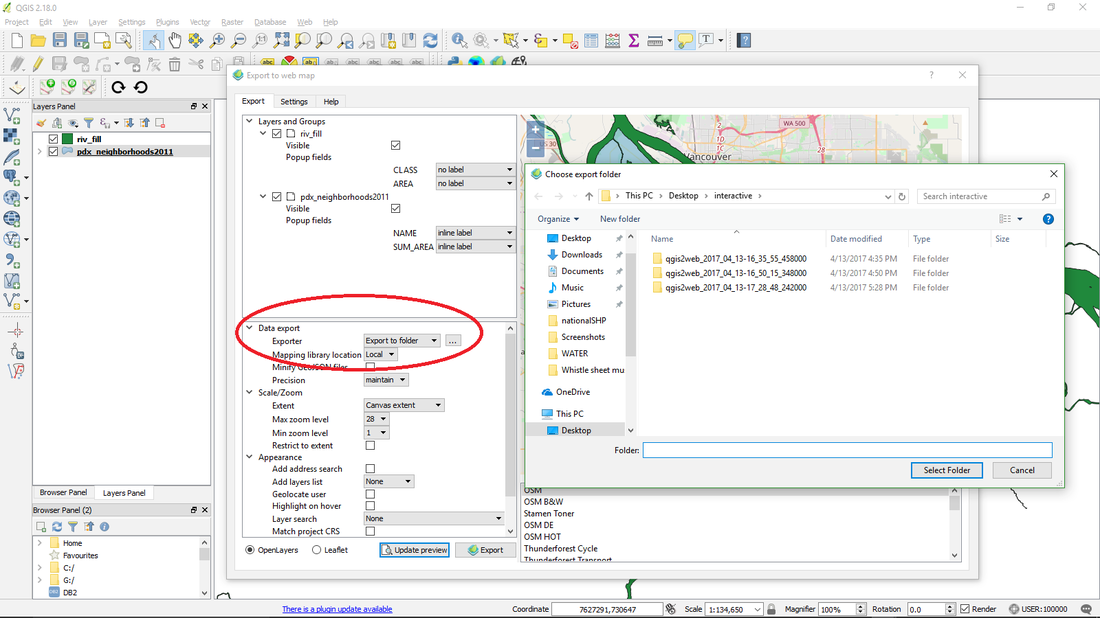 To export, hit the Export button. Immediately after exporting the map, it appears in the default web browser, with all its functionality (hopefully) ready for testing. 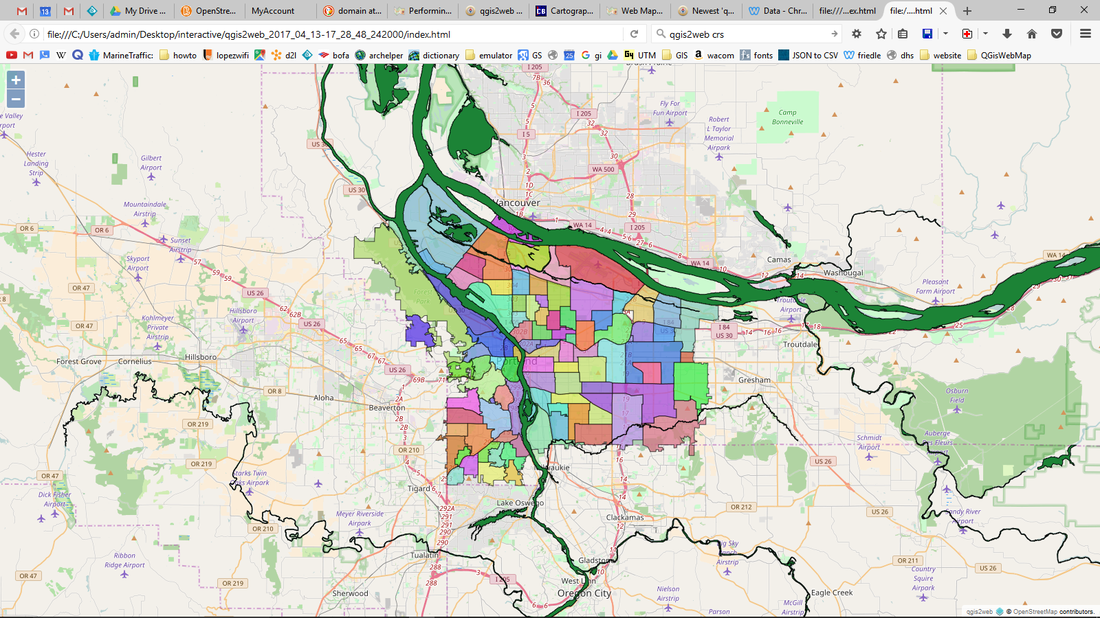 Subsequent exports will appear in adjoining browser tabs, which is useful when altering code and comparing version. To open up the new web map's files and tweak the code, navigate to the folder where the map is stored. 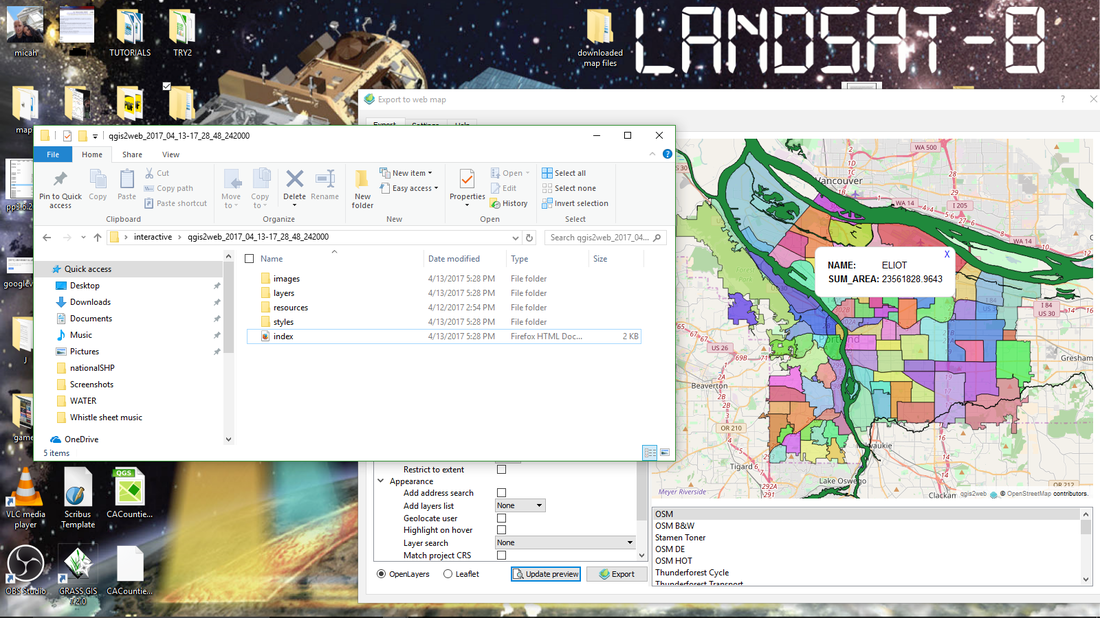 Qgis2Map organizes the files into folders in a folder whose name reflects the time and date of its creation: this is useful as it's common to do multiple exports, which are by default stored in the chosen export folder. Open up .html .css, .js, etc. files in a text editor to work on the webmap's code, save your alterations then refresh the browser window to check on your changes. The map is ready to be published online. 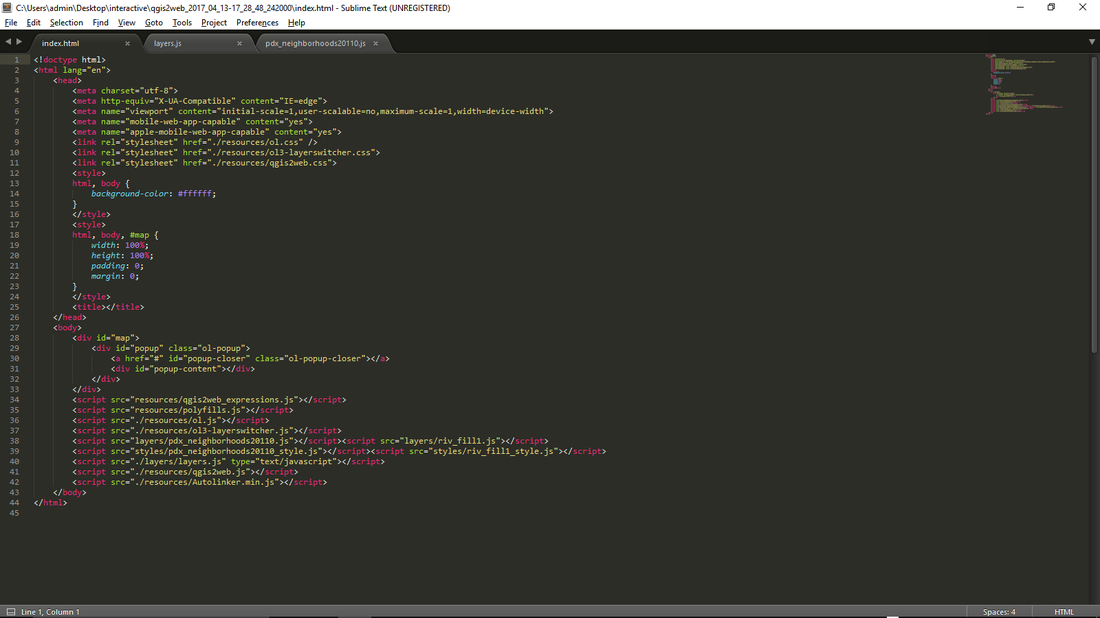 Advisory: It is important to update QGIS to the latest version (currently 18.6) and to update the GGIS2WEB plugin whenever neccesary, as both QGIS and its various plugins are in a constant state of development, updates are released periodically and by default not updated automatically. It is entirely possible that a "bug" which might hamper performance in one version has been exteminated in an updated version. QGIS update notifications appear upon opening the application, and plugin update notifications are available under the "plugin" dropdown menu. Support: The GIS Stack Exchange https://gis.stackexchange.com/ has active GGIS2WEB discussion threads, to which the developers contribute from time to time. Questions which are appropriately pithy and non redundant (meaning, don't be too wordy and make sure to search the website to see if your question has already been answered) are often answered with in a day or two. |
AuthorBlog posts are written by students in the Interactive Map Design course at Portland Community College. Archives
June 2018
Categories |
 RSS Feed