|
Written by Jay Yungerman
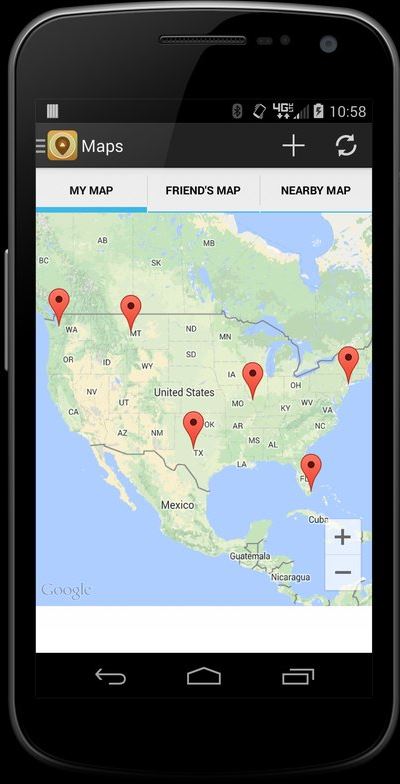
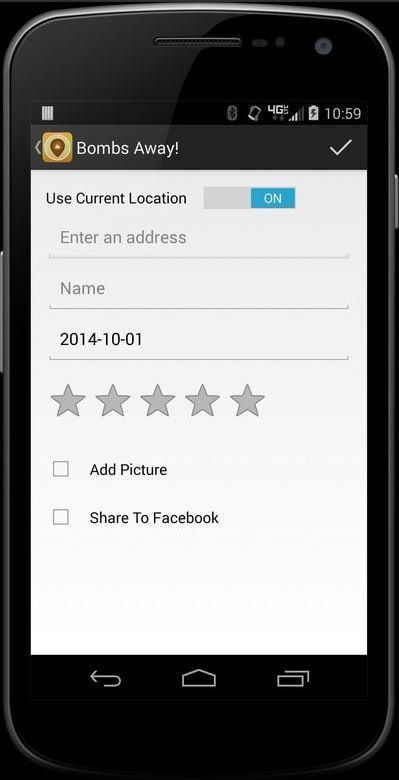
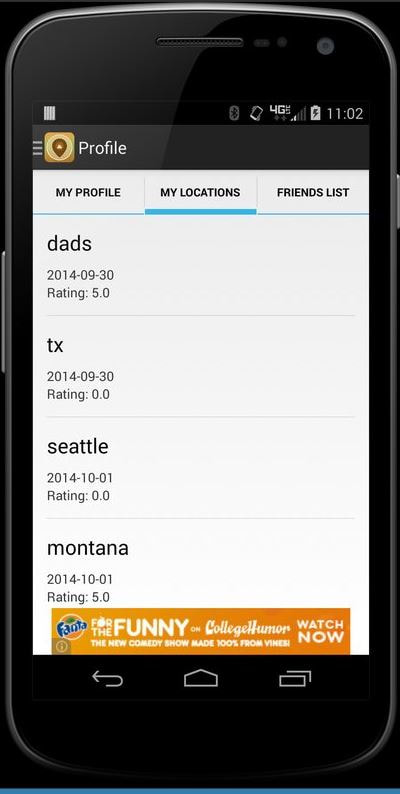
There are lots of apps out there that allow you to check-in at a location, allow your friends to like, cheers, high five, or acknowledge in some other way that they like where you are. This is a great utility for the apps that provide the feature but there can also be a benefit to the location, intended or unintended. These apps create a map of sharing which is what it’s all about right? There is one app that I, and some of my coworkers, used when working in the field, that had unintended benefits. The app was called “Places I’ve Pooped”, yes I know, how crude of me! But it’s something we all do and when you are working outdoors it’s kind of entertaining. The benefit that we derived from the app was having a dropped pin at a job site. This was useful because sometimes it would be months between site visits and people have a tendency to forget directions. So this turned out to be really useful as well as funny because you could see how many pins were at each site. I only used this site for outdoor locations, but you can see other people’s pins and they are everywhere. It dawned on me that this could be really useful as a toilet locator tool. How many times has it happened that you’re walking around and all of a sudden you need to use a toilet but you don’t know where one is; if you had this app you could be saved…or one of the dozens of actual toilet locator apps. The app is available for Android and has several copycats, and it is available on iOS as well. There are toilet finder apps out there but this is a bit more interactive and if you have gross friends like me it’s entertaining and you could even make a game out of it. Hope you enjoyed the read!
0 Comments
Written by Rana Hasan
Before I came to the USA three years ago, I was living on other side of this world, and since I have arrived to the USA, people have asked me a common and friendly question, "Where are you from?" I am from Iraq; this question inspired me to create a story map, which is a tour map of Iraq. Because each time I answer this question I was surprised people didn’t know much about my country. So I thought this blog post is a good opportunity to share with the GIS student some information related to location and to the geographic nature of Iraq, by creating a tour map "Cascade." So in some way, through this tour map you can get an idea of the geography of Iraq and explore some places you might unfamiliar with.. What information does my tour map include?
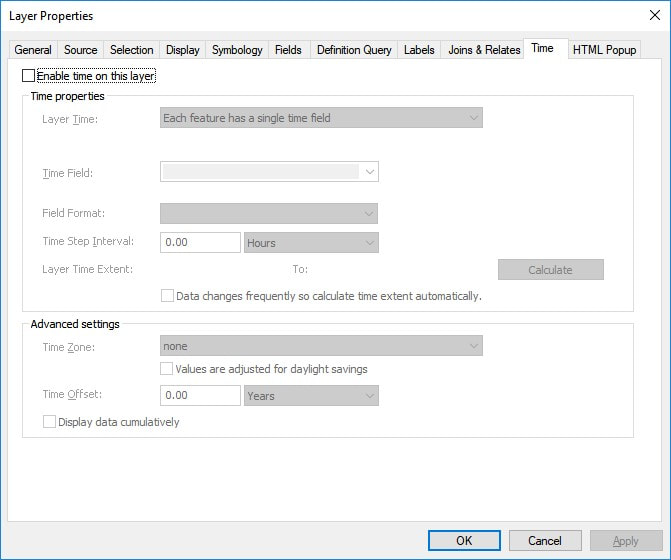
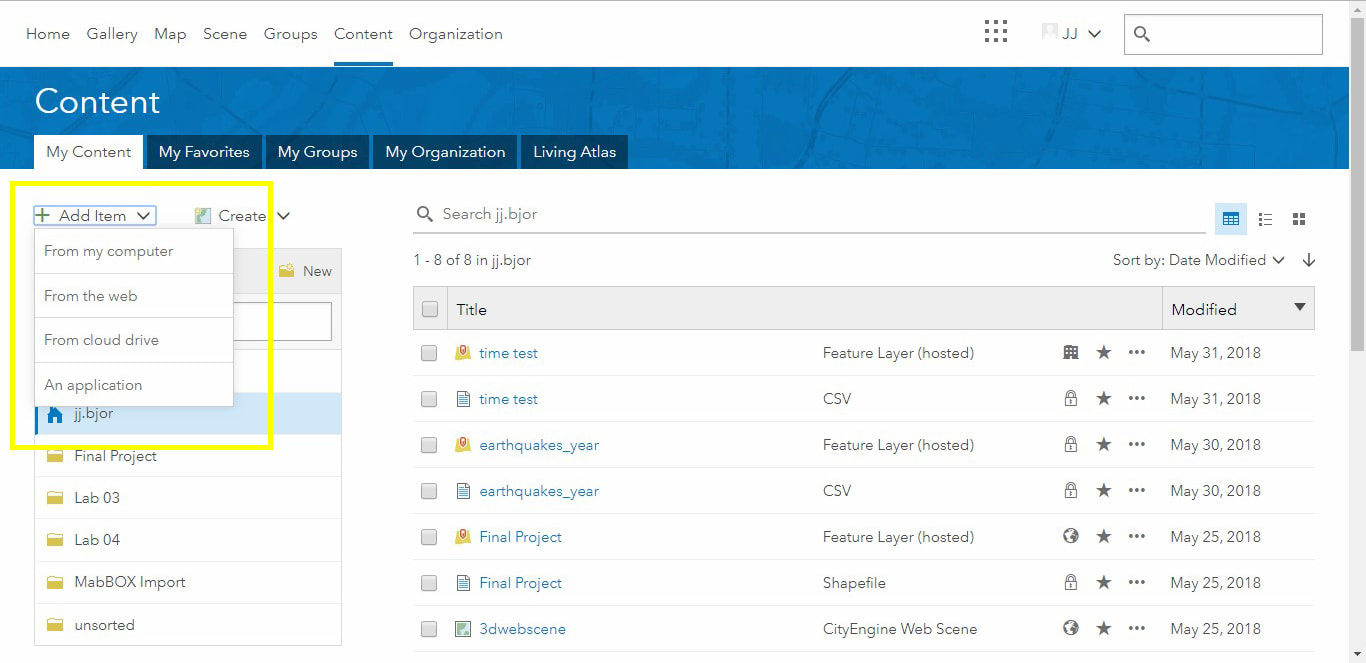
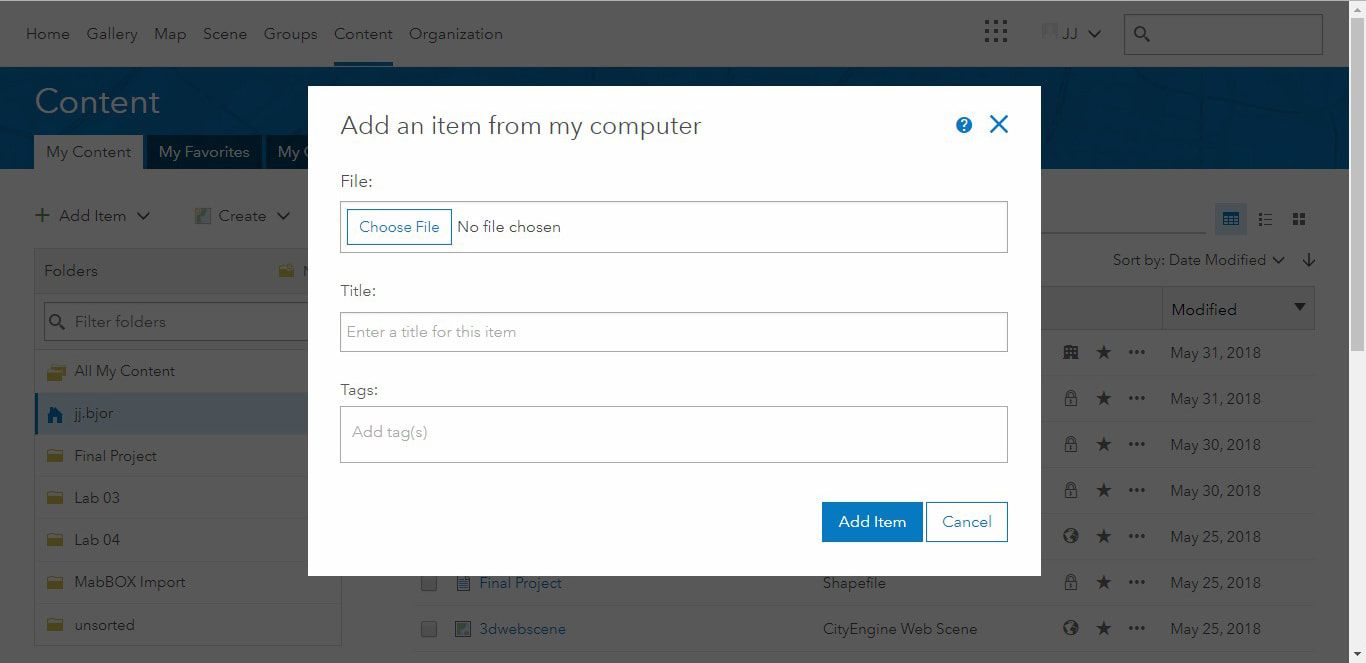
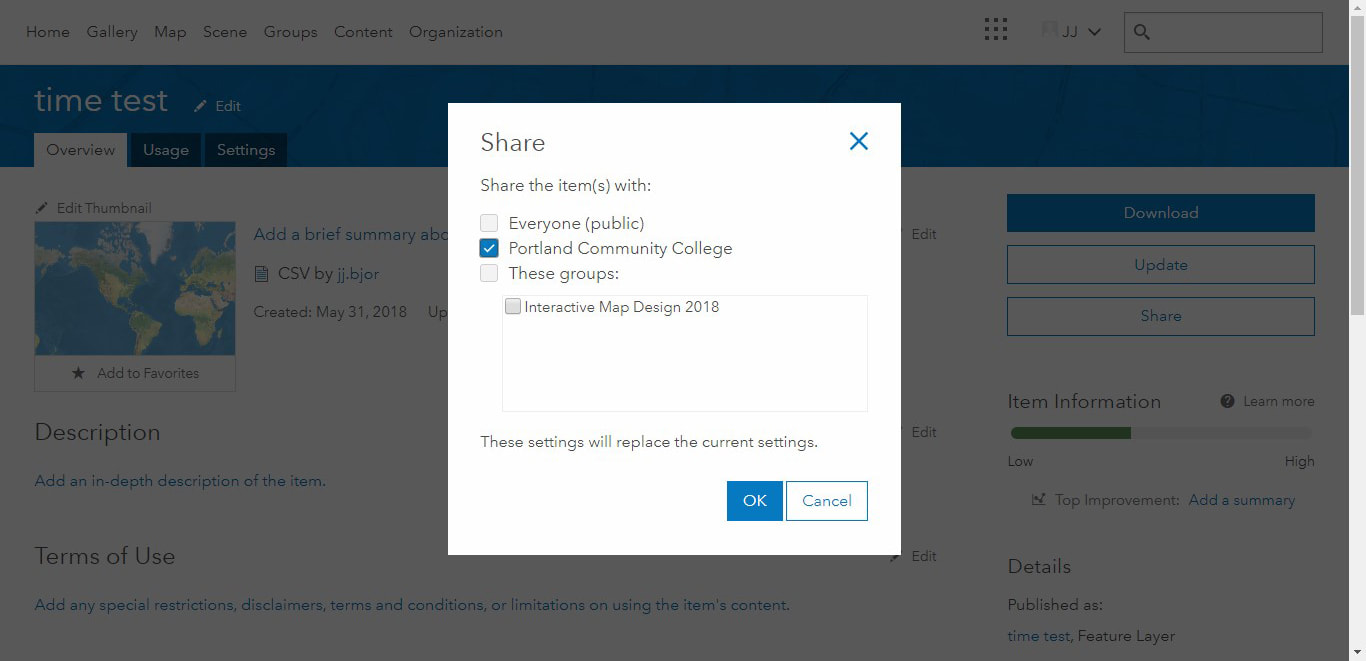
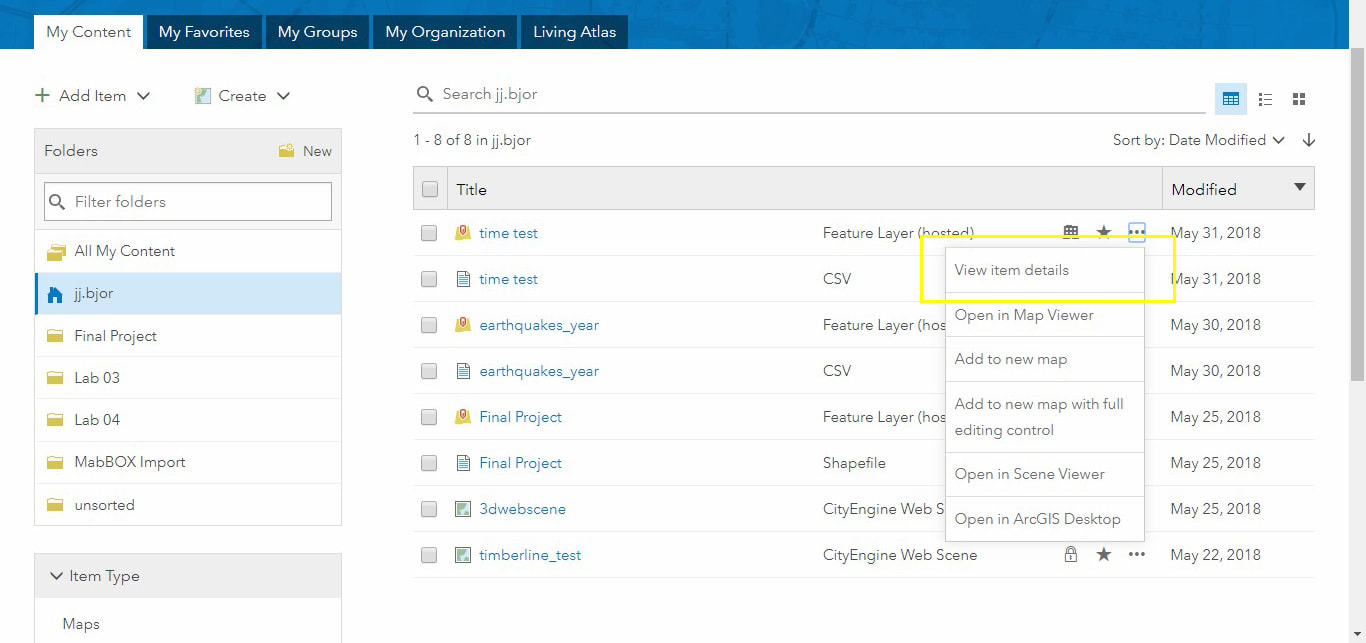
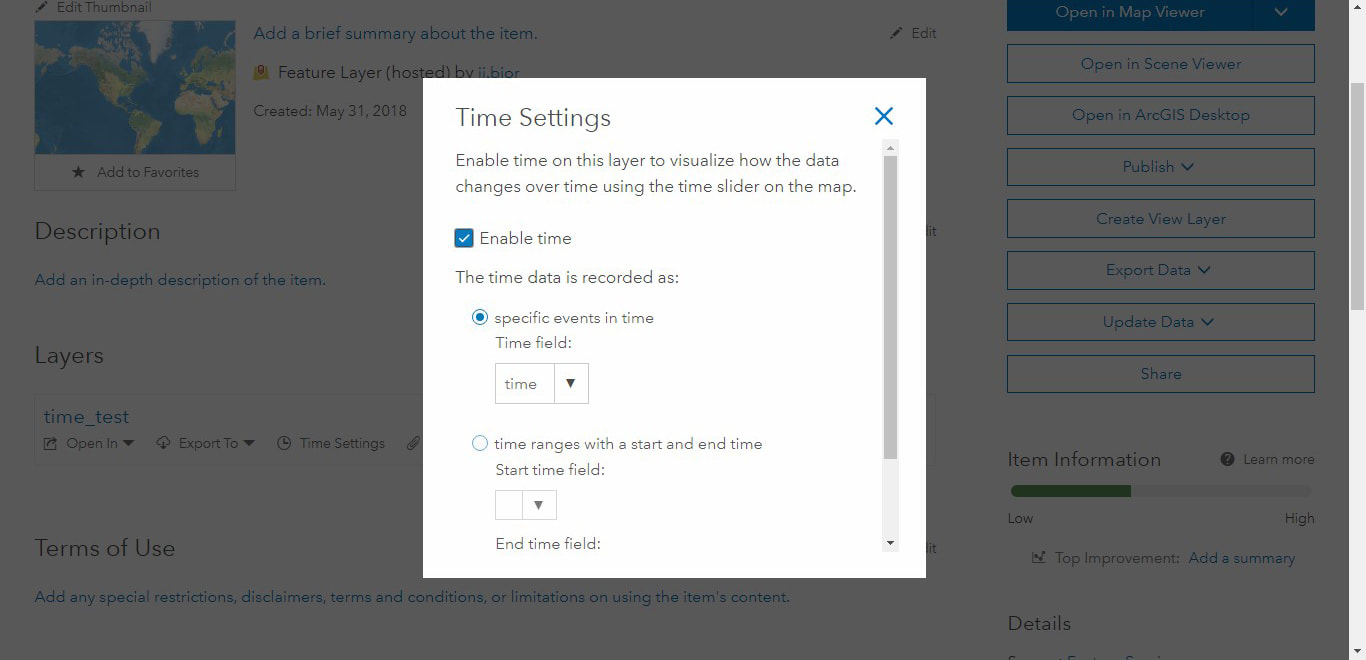
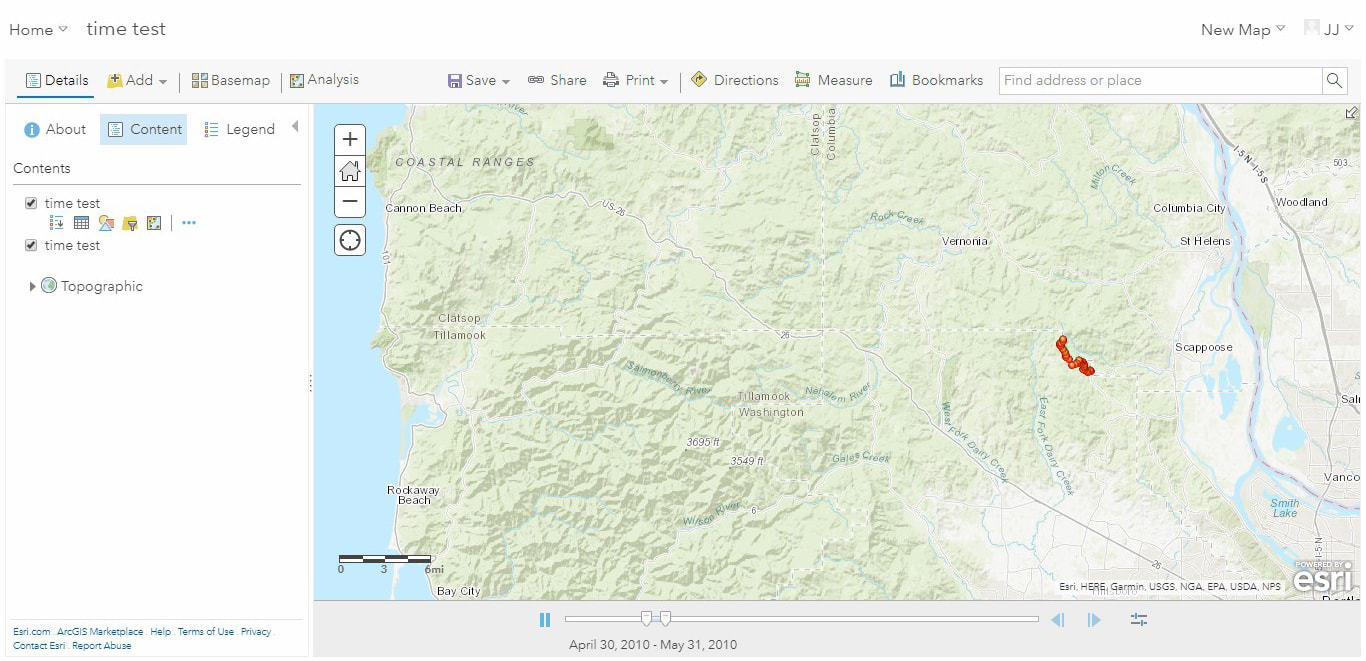
https://arcg.is/0WGL9G Written by JJ Bjordahl Do people who want animated maps have to know crazy web-code magic spells to make their maps move? NO! You can time enable your data in ESRI products and here are some ways how! Have you ever noticed under feature class properties in Arcdesktop that there is a Time tab? See for yourself below… Well if the data you upload onto AGOL has time references you can enable those too. Let’s try~ For an example I’ve prepared a simple data set (i.e. coordinates and time) which you can download as a comma separated value file (*.csv). Note: you must be logged into your PCC.edu Gmail account to access the Drive shared file. Get the time referenced example data here --> https://docs.google.com/spreadsheets/d/1MXtSnAH-keHCp7dzP6CY3etvF7KD_yPjlEeZB1qyCD0/edit?usp=sharing The *.csv has three columns Lat, Long, and Time. If you’re not already logged into AGOL and in your Content section go ahead and do that… while in your AGOL Contents you can ‘+ Add Item… from my computer,’ so add the example *.csv. We need to ‘Host’ via PCC’s AGOL relationship so ‘Share’ the csv with PCC so it becomes ‘Hosted.’ Now check in ‘Content’ to see that our file show as a ‘Feature Layer (hosted)’ and then click into the file’s ‘Item Details’ and go into Time Settings… The csv I provided has a single time reference for each data point and thus not a start and end time… Now that time is enabled (if it ain’t… hmm… uh… hmmm… maybe start over? It ought be!) open the hosted file in MapViewer and you’ll notice there’s a time slider with configurable options at the bottom of the map! Now you can change the rate at which the data is displayed, the amount of data displayed per segment, to add the points as time progresses or only show points within a set time frame etc… I set the speed to fast and in ‘advanced options’ set the interval to display in monthly chunks and now my points look like an ancient cell phone worm game crawling across Oregon.
Written by Natalie Divine When I signed up for my first ArcGIS account I guess I forgot to uncheck the “add me to your mailing list” box because I began receiving ArcNews a few months ago. The first thing that I noticed on the front page of the Winter2018 issue was an article titled, “Learn to Design Beautiful Maps – Take ESRI’s Newest Massive Open Online Course: Cartography.” The headline reeled me in. I’m here to tell you, I highly recommend taking a “MOOC” (Massive Open Online Course) from ESRI. Here’s why:
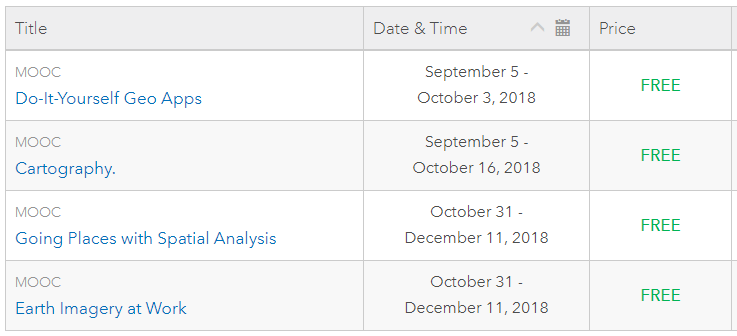
There is a little bit of set up required – you have to download the lessons and then create a new username and then download ArcPro and then get your ArcPro login – but after that it is super user-friendly. No software is required, just a computer with internet. Some of my favorites parts so far are segments of the videos called “Cartofails” about all of the cartographic no-no’s (naming your legend “Legend”), and also “Tools of the trade” where they bring out old handheld cartographic tools like scribers and explain how mapmakers used them. MOOCs are on the rise in general and aimed at being free and open to everyone. I have also read about a some that are free to take and then for a fee (usually around $50-$100) you can upgrade and receive a certificate. These are offered from places like Future Learn, Coursera, Khan Academy, and edX, to name a few. Future Learn offers a MOOC called “Maps and the Geospatial Revolution” developed by Penn State, and edX has one called “Introduction to Urban Geo-Informatics” developed by Hong Kong Polytechnic University. If any of this has piqued your interest, check out this schedule of ESRI’s fall offerings: I for one will be taking Do-It-Yourself Geo Apps to continue building on web mapping skills I’ve gained in GEO244. Here is the course description,
“Anyone can build apps on the ArcGIS Platform. You don't have to be a software developer to build valuable geo-enabled apps that make your communities smarter and businesses more successful. This course will show you how to combine location and narrative in one application to better communicate and broadcast your story, create custom web applications that solve problems in your community, and build powerful native applications for iOS and Android devices without touching a piece of code. If you are a developer, you'll be interested in Esri's APIs, SDKs, and the buzzing GeoDev community.” See you there! |
AuthorBlog posts are written by students in the Interactive Map Design course at Portland Community College. Archives
June 2018
Categories |
 RSS Feed